A few weeks ago (July 12 ) I commented that while the bull market was still every much in tact --
" we are approaching S & P 2000 and are within range of the old Nasdaq closing high of 4,696. Given this recent upward move those levels could prove formidable to 'take out" on THIS attempt. Also of note, we are entering a seasonally weak period for equities in Aug & Sept."
This week the "noise" truly ramped up and caused a sell off in equities --- rate fears- 10 yr yield rising , "fed behind the curve" chants, Russia sanctions will take the entire Euro complex down,
Portugal bank issues, technical break below S & P 1950 , on and on.
Highlighting that noise on the economic front was a lower than expected Chicago PMI number. Of course, that was another reason for some folks to hit the sell button, as they took one data point and decided the entire recovery was somehow in question. Meanwhile one day later a very positive ISM Manufacturing report was met with a yawn. Economists were expecting a level of 56.0, the actual reading came in at 57.1, which was up nearly two points from last month's reading of 55.3. After this month's increase the ISM Manufacturing Index is sitting at its best level since April 2011.
After the "Jobs number" was reported on Friday, traders couldn't decide whether it was good or bad - as the S & P futures erased a 14 point decline --- opened flat then went on a ride down to 1916, erased that loss to go positive for a while then closed down 5 @ 1925. That type of action shows the crosscurrents pulling in both directions and now it may take some time for the market to sort this out.
Another positive fact that seems to have gone unnoticed in all of the geopolitical headlines--- positive news on China.
China PMI --- http://bit.ly/1tn9Vjt
And with that along with other positive data, the Chinese Stock market (FXI) has now broken out to the upside in the last few trading days and is a bullish sign for the global economy ..
www.bloomberg.com/news/2014-07-29/china-...
The takeaway is that the entire recovery is very much in place, nothing has changed other than the mindset of the Knee- Jerk traders.
So with a few positives out there regarding the global economy, one of the items high on the markets worry list are rising interest rate fears. I have already demonstrated that rising rates doesnt mean the end to this bull market.
More evidence to that effect, but unfortunately, there is no exact rule of thumb that will give all of us a simple investment formula. But it can give a guideline combined with other variables to point one in the right direction.
When the data is analyzed, it has shown that 75% of the time when rates were rising, stocks tended to rise as well. When one looks at the conditions during these periods of rising stocks and rates, the 10-year bond yield averaged 5.11 percent, the price-earnings ratio of the S&P 500 averaged about 15, and inflation as measured by the consumer price index was more than 4 percent. The average S&P 500 increase during these periods was almost 21 percent.
In the instances when rates rose and stocks fell, the S&P 500 declined almost 16 percent on average. At the same time, the 10-year bond yield averaged more than 6 percent, the P/E ratio for stocks was a historically low 12.57 and inflation was high, averaging 6.8 percent. This combination of high rates, rapid inflation and cheap (and getting cheaper) stocks typically implies a recessionary environment.
My takeaway: When inflation is high, and rates are going up from already elevated levels, we see a negative impact on stocks. When inflation is subdued, and rates start increasing from low levels, the impact on stocks is positive.
This latter case is most similar to the environment we are in today, so the evidence isn't there for me to buy into the overwhelming theories and ideas that increased interest rates will be a determent for the S&P 500. A pullback, correction, from irrational behavior on the part of traders, possibly, but it need not mark the end of the bull cycle.
So on the "rate" front, if history holds true, rising rates this year or next shouldn't hurt either the economy or the equity markets.
The "Technical Picture "
A look at the "Technicals" can provide some clues as to where the S & P may be headed...
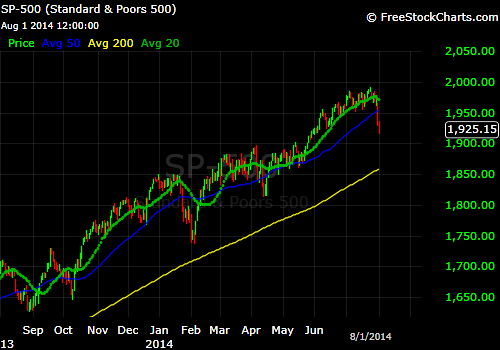
Looking at the last two declines for the S & P in Feb and April - the relatives strength indicators I use, bottomed out at approximately the same level for each of those declines. When they turned upward, these indicators gave a good signal that the market was about to start back on its upward path.
With the current price of 1925, I note that these same indicators have not yet reached those same extreme oversold levels as in the last two pullbacks.
While these indicators are not infallible, they do provide a useful tool (along with others I use) to help decide when the selling may abate. Therefore I suggest that we may see further weakness and perhaps drop to the 1890 - 1900 range on the S &P as I stated on Thursday here on SA.
If I had to make a call (guess) right now -- S & P down to 1890 level or 4-5% from the high .. a break there and we get the 10-12% correction..
To follow up on that remark, I am of the opinion that we have a good chance of going back to the levels on the S & P at the beginning of this year - 1848. That of course would imply that the S & P will indeed follow what has just happened to the Dow 30 index at it has now given back it's entire 2014 gain.
IF, and that is a big IF, the index would in fact have breached its 200 day MA and give the "flush" that so many say is needed. However, to put that into context, it still would only be 7% from the highs. Hardly a stretch given the fact that the market has been up in 5 of the last 6 months.
These type of calls are dynamic in nature and will always change with the landscape being presented. However when I look at the "technical damage" done, added to the facts I mentioned earlier about the upcoming weak seasonal period, it may just make this pullback a bit more severe than what has transpired in the past .
All of this is still within the construct of secular bull market and at the moment is of no consequence to the Longer term uptrend that has been established as shown in the accompanying chart provided.
Another key on the technical picture may be what is transpiring in the chart of the (RUT)
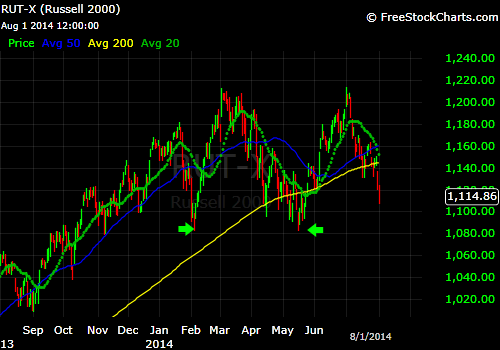
I pointed out the double pattern back on June 14th, while the bears are pointing out the (RUT) has topped & the weakness in the index is a "key" to their theory that the RUT will take down the entire market.
In my view, until the index breaks one way or the other, talk of a " boom" or "doom" scenario, is just that "talk". There also exists the possibility that the index trades in this range until the final direction is decided.
And then there are the earnings reports, which are solid as forecasted.
With not quite 50% of the S & P 500 having reported q2 '14 earnings, per Thomson Reuters, the y/y growth rate in q2 '14 earnings is +6.5%, or excluding that one time Citigroup charge, +8.2%. We will have the bulk of earnings reported in the next 3 weeks.
In this "noisy' period, where every headline and economic number being reported is sliced, diced and sliced again, the positive earnings picture will be lost and shuffled to the background by those displaying irrational behavior.
Recognizing that fact separates the Knee- Jerk TRADERS from the INVESTORS.
An update on my 2014 selections and the performance of the stocks I have written articles on this year as well.
(AAP), (LVS), (MU) are looking attractive after their recent sell off.
Best of Luck to all !
Disclosure: The author is long AAP, LVS, MU.
Additional disclosure: I am long numerous equity positions - all of which can be seen here on my Instablog."It is my intention to present an introduction to these securities and state my intent and position. It should be used as a 'Starting Point' to conduct your own Due Diligence before making any investment decision.