This result is quite astounding.
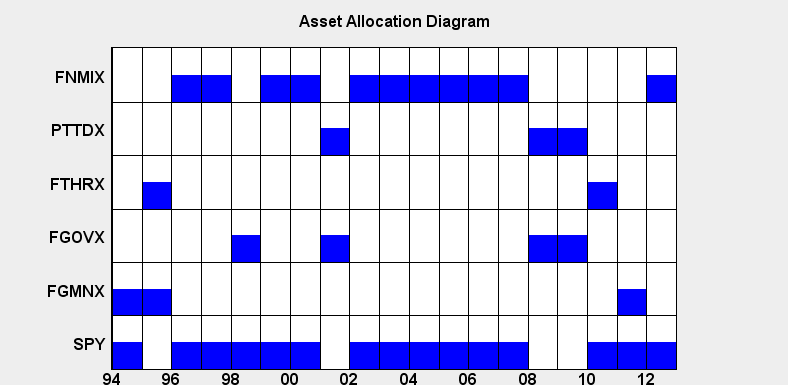
On the first trading day of the year invest in the equally weighted portfolio of the two assets among SPY, FGMNX, FGOVX, FTHRX, FNMIX, and PTTDX whose performance was the best during the prior quarter (Sept. 30 thru Dec. 31 of the prior year).
CAGR (1994-2012) 11.9%
Sharpe Ratio 0.82 (Annualized based on monthly returns)
Beta .38 (R-Square is only .42 though.)
Maximum monthly Drawdown 15%
Number of years with losses 2 (1994 -.2%, 2002 -4.3%)
2012 Return 17.4%
Three Year CAGR 11%
Five Year CAGR 9.4%
Ten Year CAGR 11.1%
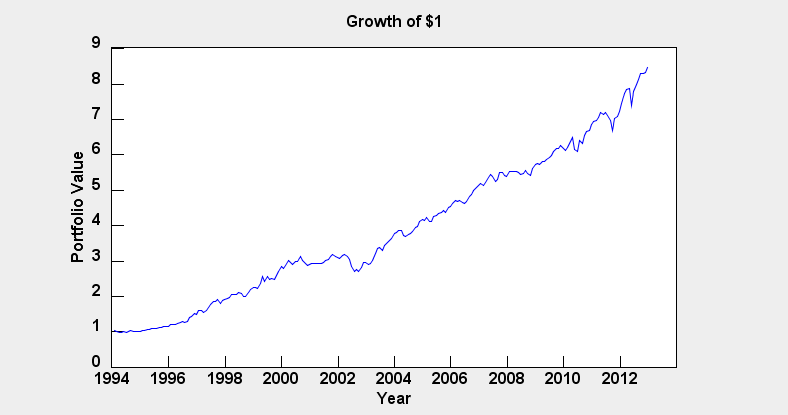
The portfolio growth curve and the asset allocations in various years are shown in the following plots.
The safe withdrawal rate for this strategy is 6.1% (i.e. if you withdraw 6.1% of the portfolio at the beginning of the first year, and increase your withdrawal by 3% annually thereafter, the probability that your portfolio will last at least for thirty years is 95%).
That the strategy dictates that one invest in an equally weighted portfolio of FNMIX and FTHRX in 2013 immediately underscores the problem with it: who would have wanted to buy fixed income assets at the close of the day yesterday without cringing and closing his eyes? In any case it does seem to provide a nice benchmark to see how your portfolio stacks up against a strategy that is very easily implemented if emotions are completely set aside and has worked quite well in the past.
Disclosure: I have no positions in any stocks mentioned, and no plans to initiate any positions within the next 72 hours.