This is a quarterly rebalancing strategy that works well to minimize portfolio volatility without any significant deleterious effect on the returns.
- The basket consists of two parts (a) a set of assets nominally correlated with the market, typically equity ETFs and (b) a set of assets which have low or negative correlation with the market, typically fixed income ETFs. The number of fixed income assets should be as many as or preferably more than the number of equity assets.
- The rebalancing schedule consists of three tranches:
(a)at the beginning of every quarter choose a set of assets that performed the best during the immediately preceding month,
(b)at the beginning of every half-year choose a set of assets that performed the best during the immediately preceding month, and
(c)at the beginning of every year choose a set of assets that performed the best during the immediately preceding quarter.
Obviously the assets from the three tranches can be commingled at the beginning of each quarter to be equally divided in the three trenches. Further the number of selected assets should be close to the number of equity ETFs in the basket (as in 1(a)).
As an example we consider a modified version of The All Weather Portfolio (although any combination of equity and fixed income assets works well) described here: https://seekingalpha.com/article/1289651-allocating-within-the-all-weather-sailboat-portfolio-part-2 . My calculations (many of which span periods starting in 1991) suggest that any basket satisfying the criteria described above will yield similar or better results.
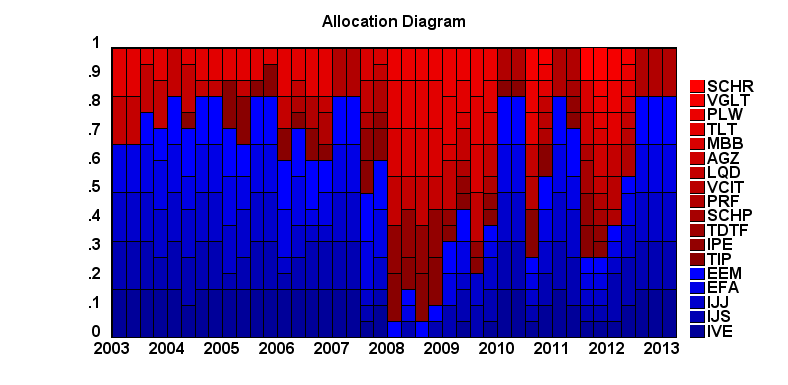
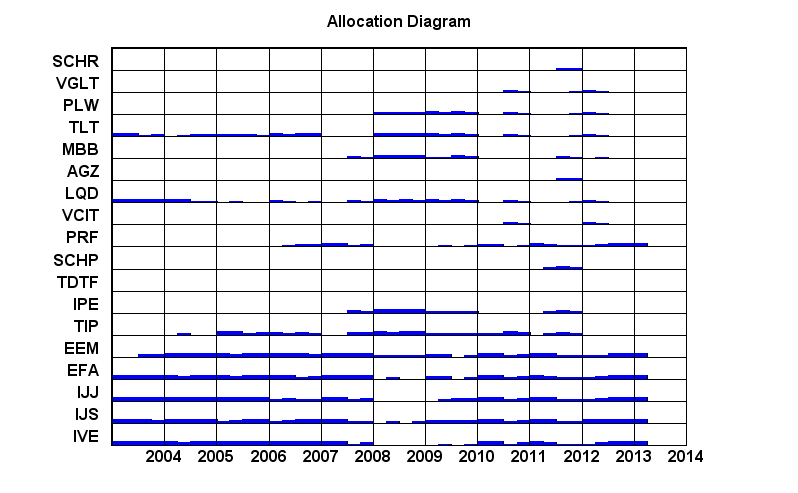
The basket consists of the following:
IVE IJS IJJ EFA EEM TIP
IPE TDTF SCHP PRF VCIT LQD
AGZ MBB TLT PLW VGLT SCHR
At each update for each trench, six assets were chosen.
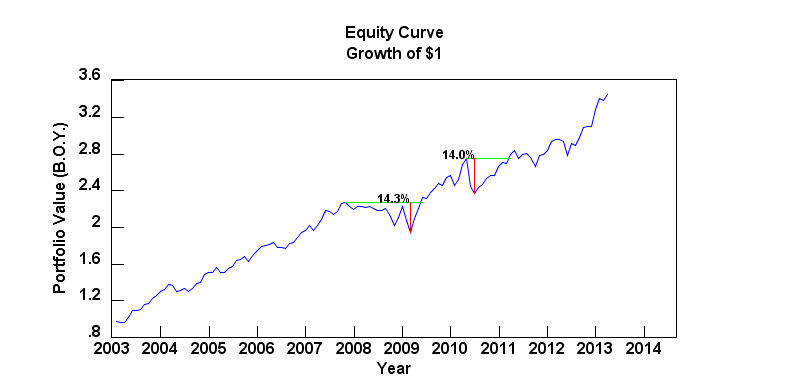
Here are the results for 2003:2013
CAGR 12.85%
Sharpe Ratio .86
Kelly Fraction .41
Monthly One Factor Alpha .54%
Monthly One Factor Beta .54
Monthly One Factor R^2 .56
The equity curve, the Manhattan asset allocation diagram and the basic asset allocation diagram are shown below.