VALUATION WARNING: Our models find that overvaluation is at levels typically seen when market pullbacks occur. Overvalued stocks assigned a valuation now make up 75% of our universe and 42% of the stocks assigned a valuation are calculated to be overvalued by 20% or more. 15 of 16 sectors are calculated to be overvalued--14 of them by double digits.
Pick Up the Phone--Telecom Argentina Provides 30% Return for VE View
TELECOM ARGENTINA (TEO) holds a license to provide basic telephone service and fixes telecommunications links in the northern region of the Argentine Republic. The Company contributes to the country?s economic and social development by means of incorporating the latest technological advances achieved to-date in the field of telecommunications world-wide.
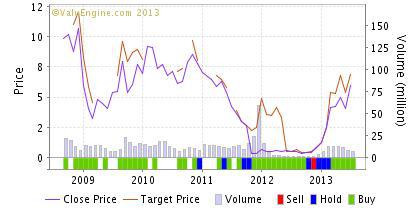
TELECOM ARGENTINA currently leads our long-only ValuEngine View portfolio newsletter. When originally selected for the View this month, the stock was at $15.23/share. As of yesterday's close, the stock was at $19.91/share for a gain in excess of 30%.
ValuEngine continues its STRONG BUY recommendation on TELECOM ARGENTINA for 2013-08-19. Based on the information we have gathered and our resulting research, we feel that TELECOM ARGENTINA has the probability to OUTPERFORM average market performance for the next year. The company exhibits ATTRACTIVE P/E Ratio and Momentum.
Below is today's data on TEO:
ValuEngine Forecast | ||
|---|---|---|
Target Price* | Expected Return | |
1-Month | 20.21 | 1.51% |
3-Month | 21.99 | 10.47% |
6-Month | 22.89 | 14.96% |
1-Year | 23.51 | 18.09% |
2-Year | 29.48 | 48.09% |
3-Year | 34.08 | 71.17% |
Valuation | n/a | Valuation Rank | 80 |
1-M Forecast Return | 1.51% | 1-M Forecast Return Rank | 99 |
12-M Return | 62.53% | Momentum Rank | 89 |
Sharpe Ratio | 0.07 | Sharpe Ratio Rank | 63 |
5-Y Avg Annual Return | 3.78% | 5-Y Avg Annual Rtn Rank | 67 |
Volatility | 56.92% | Volatility Rank | 44 |
Expected EPS Growth | 1.22% | EPS Growth Rank | 22 |
Market Cap (billions) | 3.92 | Size Rank | 84 |
Trailing P/E Ratio | 6.77 | Trailing P/E Rank | 98 |
Forward P/E Ratio | 6.69 | Forward P/E Ratio Rank | 96 |
PEG Ratio | 5.56 | PEG Ratio Rank | 5 |
Price/Sales | 0.81 | Price/Sales Rank | 69 |
Market/Book | 2.03 | Market/Book Rank | 48 |
Beta | 1.43 | Beta Rank | 34 |
Alpha | 0 | Alpha Rank | 59 |
Summary of VE Stock Universe | |
|---|---|
Stocks Undervalued | 25.02% |
Stocks Overvalued | 74.98% |
Stocks Undervalued by 20% | 9.98% |
Stocks Overvalued by 20% | 41.96% |
Sector | Change | MTD | YTD | Valuation | Last 12-MReturn | P/E Ratio |
|---|---|---|---|---|---|---|
Aerospace | -2.11% | -0.51% | 25.70% | 21.80% overvalued | 34.28% | 17.5 |
Auto-Tires-Trucks | -0.54% | 1.71% | 38.44% | 28.11% overvalued | 43.12% | 20.48 |
Basic Materials | -1.26% | 2.71% | 2.57% | 3.42% undervalued | -21.42% | 19.97 |
Business Services | -0.60% | -1.66% | 69.14% | 19.55% overvalued | 24.01% | 23.3 |
Computer and Technology | -0.93% | -0.93% | 25.99% | 22.01% overvalued | 23.22% | 29.75 |
Construction | -0.84% | -2.45% | 25.84% | 16.46% overvalued | 31.30% | 24.49 |
Consumer Discretionary | -0.67% | -0.49% | 28.32% | 23.46% overvalued | 27.15% | 24.32 |
Consumer Staples | -0.61% | -2.18% | 14.42% | 17.73% overvalued | 17.97% | 21.5 |
Finance | -1.04% | -1.92% | 22.31% | 18.70% overvalued | 15.03% | 17.49 |
Industrial Products | -0.59% | 1.23% | 32.70% | 20.17% overvalued | 29.38% | 21.5 |
Medical | -0.39% | 0.14% | 194.76% | 19.17% overvalued | 21.94% | 26.29 |
Multi-Sector Conglomerates | -1.33% | -0.20% | 5.95% | 25.14% overvalued | 13.39% | 17.3 |
Oils-Energy | -1.37% | -3.31% | 20.05% | 5.77% overvalued | 2.78% | 26.51 |
Retail-Wholesale | -0.58% | -3.29% | 28.87% | 23.91% overvalued | 34.93% | 23.3 |
Transportation | -0.63% | -1.87% | 18.28% | 19.81% overvalued | 24.84% | 19.13 |
Utilities | -1.33% | -1.42% | 11.52% | 9.18% overvalued | 8.55% | 18.83 |
Disclosure: I have no positions in any stocks mentioned, and no plans to initiate any positions within the next 72 hours.