VALUATION WARNING: Our models find that overvaluation is at levels typically seen when market pullbacks occur. Overvalued stocks assigned a valuation now make up 83% of our universe and 51% of the stocks assigned a valuation are calculated to be overvalued by 20% or more. 15 of 16 sectors are calculated to be overvalued--15 of them by double digits.
Hot Coffee--VE Maintains Buy on Green Mountain Coffee Roasters
Green Mountain Coffee Roasters engages in the production and marketing of award-winning coffees, innovative brewing technology and gourmet single-cup brewing systems. The Company's operations are managed through three operating segments. The Specialty Coffee business unit sources, produces and sells coffee, cocoa, teas and other hot beverages. These varieties are sold primarily to wholesale channels. The Keurig business unit, a pioneer and leading manufacturer of gourmet single-cup brewing systems, targets its premium patented single-cup brewing systems for use at-home and away-from-home, mainly in North America. The Canadian business unit sources, produces and sells coffees in a variety of packaging formats, including K-Cup portion packs, whose brands include Van Houtte, Br?lerie St. Denis, Br?lerie Mont-Royal and Orient Express and its licensed Bigelow and Wolfgang Puck brands. Green Mountain Coffee Roasters is headquartered in Waterbury, Vermont.
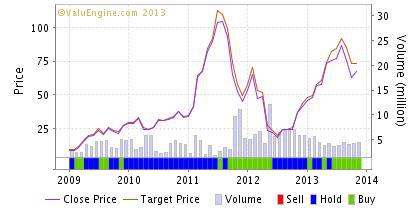
Green Mountain is a big winner for our ValuEngine View Newsletter this month. For the current rebalance period, the stock is up more than 20%. The stock has been volatile over time, but our recommendation history has been fairly robust. The stock currently shows a great forecast for all time frames. It is calculated to be overvalued, but displays excellent momentum, sharpe ratio, and long-term average annual return.
ValuEngine continues its BUY recommendation on GREEN MOUNTAIN COFFEE ROASTERS for 2013-12-16. Based on the information we have gathered and our resulting research, we feel that GREEN MOUNTAIN COFFEE ROASTERS has the probability to OUTPERFORM average market performance for the next year. The company exhibits ATTRACTIVE Sharpe Ratio and Company Size.
As a bonus to our Daily Bulletin readers, we are offering a FREE DOWNLOAD of one of our Detailed Stock Valuation Reports--this report is normally $25.00
Read our Complete Detailed Valuation Report on Green Mountain Coffee Roasters HERE.
Below is today's data on TEVA:
| ValuEngine Forecast | ||
| Target Price* | Expected Return | |
|---|---|---|
| 1-Month | 74.50 | 0.49% |
| 3-Month | 76.11 | 2.67% |
| 6-Month | 77.27 | 4.23% |
| 1-Year | 78.53 | 5.93% |
| 2-Year | 85.88 | 15.85% |
| 3-Year | 82.08 | 10.72% |
| Valuation & Rankings | |||
| Valuation | 29.79% overvalued | Valuation Rank | |
| 1-M Forecast Return | 0.49% | 1-M Forecast Return Rank | |
| 12-M Return | 90.42% | Momentum Rank | |
| Sharpe Ratio | 0.66 | Sharpe Ratio Rank | |
| 5-Y Avg Annual Return | 45.15% | 5-Y Avg Annual Rtn Rank | |
| Volatility | 68.77% | Volatility Rank | |
| Expected EPS Growth | 14.19% | EPS Growth Rank | |
| Market Cap (billions) | 11.17 | Size Rank | |
| Trailing P/E Ratio | 21.32 | Trailing P/E Rank | |
| Forward P/E Ratio | 18.67 | Forward P/E Ratio Rank | |
| PEG Ratio | 1.50 | PEG Ratio Rank | |
| Price/Sales | 2.56 | Price/Sales Rank | |
| Market/Book | 7.91 | Market/Book Rank | |
| Beta | 0.89 | Beta Rank | |
| Alpha | 1.26 | Alpha Rank | |
| Summary of VE Stock Universe | |
| Stocks Undervalued | 16.82% |
| Stocks Overvalued | 83.18% |
| Stocks Undervalued by 20% | 6.45% |
| Stocks Overvalued by 20% | 51.41% |
ValuEngine Sector Overview
| Sector | Change | MTD | YTD | Valuation | Last 12-MReturn | P/E Ratio |
| Multi-Sector Conglomerates | 0.55% | -1.71% | 14.72% | 35.52% overvalued | 19.96% | 19.26 |
| Computer and Technology | 0.83% | -1.35% | 44.31% | 27.83% overvalued | 35.01% | 31.19 |
| Consumer Discretionary | 0.48% | -0.74% | 42.17% | 27.62% overvalued | 41.26% | 29.28 |
| Auto-Tires-Trucks | 0.57% | -1.25% | 52.64% | 27.03% overvalued | 48.79% | 19.89 |
| Transportation | 0.61% | -1.14% | 34.94% | 26.71% overvalued | 45.56% | 21.60 |
| Aerospace | 1.20% | 0.44% | 43.64% | 26.54% overvalued | 45.96% | 17.91 |
| Medical | 0.67% | -1.84% | 40.09% | 25.89% overvalued | 38.05% | 28.55 |
| Business Services | 0.99% | -0.34% | 37.56% | 25.54% overvalued | 38.65% | 25.62 |
| Industrial Products | 0.91% | -0.63% | 42.40% | 24.98% overvalued | 38.41% | 23.25 |
| Retail-Wholesale | 0.58% | -2.16% | 39.96% | 23.79% overvalued | 37.50% | 24.03 |
| Consumer Staples | 0.26% | -1.47% | 27.93% | 22.58% overvalued | 25.04% | 23.21 |
| Finance | 0.57% | -0.89% | 27.17% | 22.09% overvalued | 15.59% | 17.76 |
| Construction | 1.22% | -0.53% | 40.27% | 17.18% overvalued | 32.33% | 25.10 |
| Utilities | 0.57% | -1.51% | 16.80% | 12.52% overvalued | 12.72% | 19.73 |
| Oils-Energy | 0.20% | -3.24% | 23.19% | 11.24% overvalued | 13.76% | 25.66 |
| Basic Materials | 0.57% | -2.32% | 7.55% | 0.92% undervalued | -25.63% | 19.44 |
Disclosure: I have no positions in any stocks mentioned, and no plans to initiate any positions within the next 72 hours.