Introduction:
In this article I will be analyzing Facebook Inc. (FB) from a technical perspective. I will use charting patterns and indicators to justify a long position, and then explain how I would use them to set up a trade. I will not go into the fundamentals here as there are many articles that cover them in detail, but I will mention that they have an earnings announcement on July 22nd which may impact a trade based purely on technical analysis.
Here is the chart:
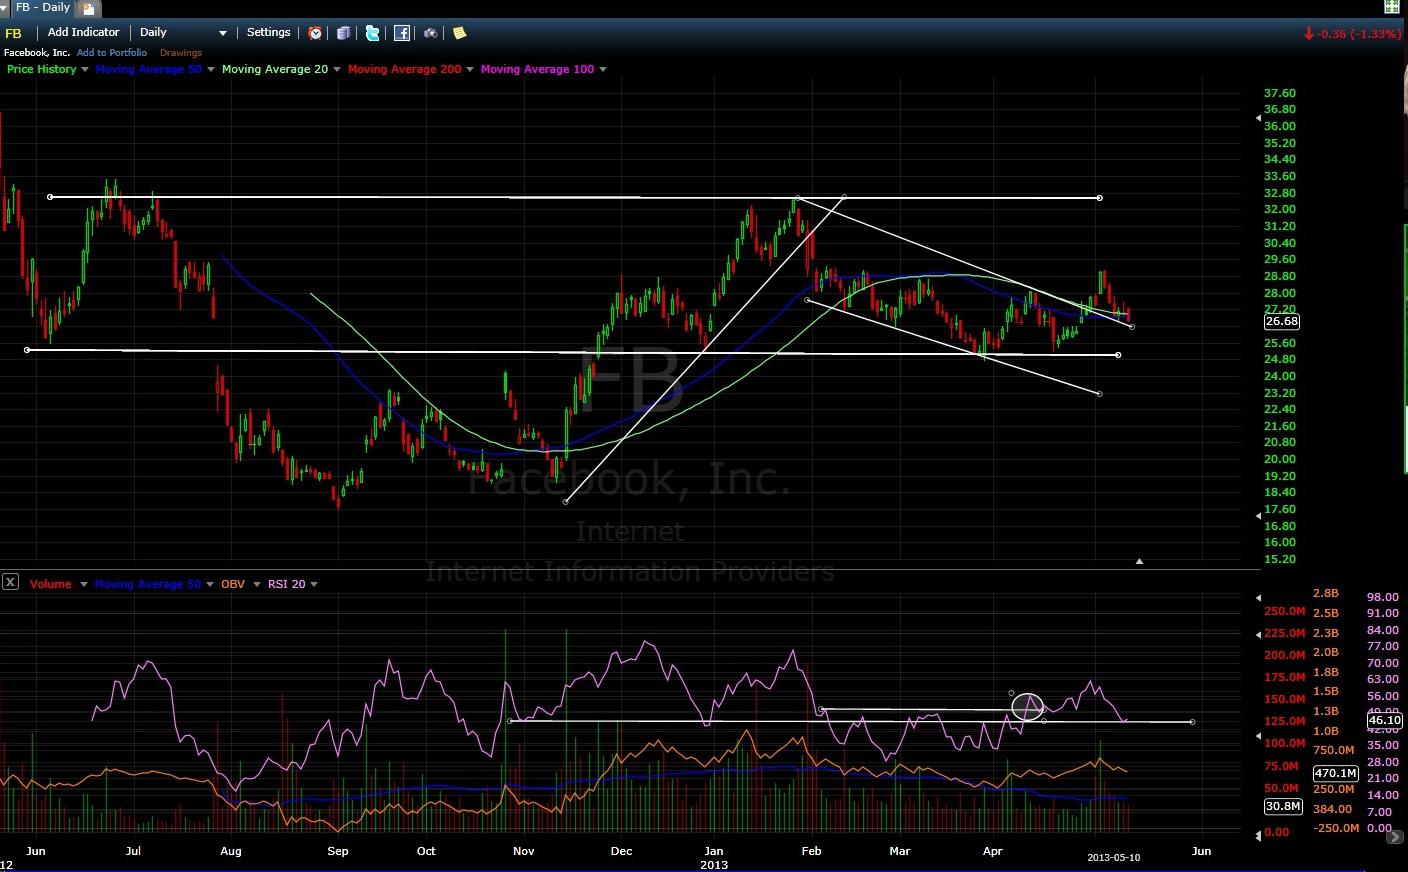 (above is 1 day chart dating back to May 2012 courtesy of freestockcharts.com)
FB price has found support at $25 four different times. In June after the abysmal IPO, in late December of 2012, and more recently in late March and mid April. This is clearly an area of strong buying interest.
Resistance at $32 has been tested 4 times. Twice shortly after the IPO, and twice during January of 2013 at it's most recent highs. Clearly, this is an area of strong selling interest.
Trend-linesThere was an incredible 2 month bull run that began mid November and wasn't broken until January 31st. After a lower trendline is breached the price often tests the next support level, which for FB was at $25. Since the January highs the price has been trending downwards, but this short term downtrend was breached in early May, indicating the minor downtrend is over.
Cup and HandleThere is a cup and handle pattern that starts at the July 2012 high and ended with the early May breakout of the minor downtrend. The cup part of the pattern starts in July 2012 and the handle starts in late January. The handle ended in early May when the upside breakout occurred.
The credibility of a cup and handle pattern is determined by the smoothness, symmetry, and depth of the cup, and the shape, depth, length, and volume behavior of the handle relative to the cup. Another important part of the cup and handle pattern is the price action before the pattern starts. Cup and handles are usually formed after a recent rally in the stock as the pattern represents a consolidation period. With FB, the opposite of a rally happened, removing credibility from the pattern. One benefit to this is that the upside is potentially much higher than a typical cup and handle, as the upside potential is usually reduced in proportion to the size of the rally before the pattern begins. Furthermore, a cup with no handle is a bullish pattern that occurs after a long downtrend, which in this case is a bullish, although weak, signal.
The main strengths of the cup and handle pattern are that the cup is fairly smooth, symmetrical, and reaches the same highs at the beginning and end of the cup, and the handle is a short term downtrend that goes approximately half the depth of the cup. The weaknesses of the cup and handle are that there was no rally before the pattern began, the handle is longer than I would like, and the handle exhibits higher volume than the cup.
RSIRSI can be used in many different ways and is most commonly used to predict reversals and retracements. During an established trend the RSI usually finds support/resistance at the same level. A breakthrough this level indicates a reversal is coming, and "bouncing off" this level indicates the end of a retracement.
During the rally from November to February the RSI found support at 45, and during the downtrend afterwards found resistance at about 51. Once the resistance at 51 was breached on the RSI, the upper trendline was breached shortly after. The RSI support at 45 should once again become support for the RSI should an uptrend commence. It should be noted that the support at 45 is being tested right now.
Analysis:The cup and handle, despite its weaknesses, is very encouraging. The support at $25 is also very strong, and the recent RSI breakout above 51 combined with the upper trend breakout shortly after add further justification to a long position. These factors combine to give a pretty strong buy signal.
Because the breakouts of the upper trend-line and the RSI already occurred, the price is less likely to touch the support at $25 again before it goes up. This is reinforced further by the RSI as the RSI support at 45 is being tested while the price remains clearly above the $25 support. According to the RSI, if the uptrend has already begun, the price won't reach $25 because the buy signal has already been given and the retracement is over.
RSI, however, is more of a secondary indicator and should not be relied on by itself to make trading decisions. Instead I will consider the RSI breakout a general bullish signal, and use other means to determine an entry point.
That's where the cup and handle and the support come in. The support at $25 compliments the cup and handle pattern very nicely as both the cup and the handle use it for support. Although the RSI suggests this support won't be tested again, the low volume on the handle breakout suggests otherwise. Combining this information suggests that the support at $25 may be touched again and would make a low risk entry point.
Trade Setup:Buy the stock with a limit order at $25 with an initial stop just below it at your desired max loss. The lower the stop the higher chance of success, but the more capital is at risk. The shorter the desired time frame, the tighter the stop should be.
A price target of $32 is a valid target as resistance around this level has been fierce. The cup and handle suggests a price target around $40 (adding the height of the cup to the breakout price), but a $32 target is more conservative and still presents a very attractive risk/reward opportunity. An alternative option is to sell a portion of the position at $32 and adjust the stop to recent lows as new highs are made afterwards.
Disclosure: I have no positions in any stocks mentioned, but may initiate a long position in FB over the next 72 hours.