ARM 3T Trend Analysis™
A Trader's Research Tool That Identifies Three Major Stock Trends
Daily ARM 3T Trend Analysis© Report
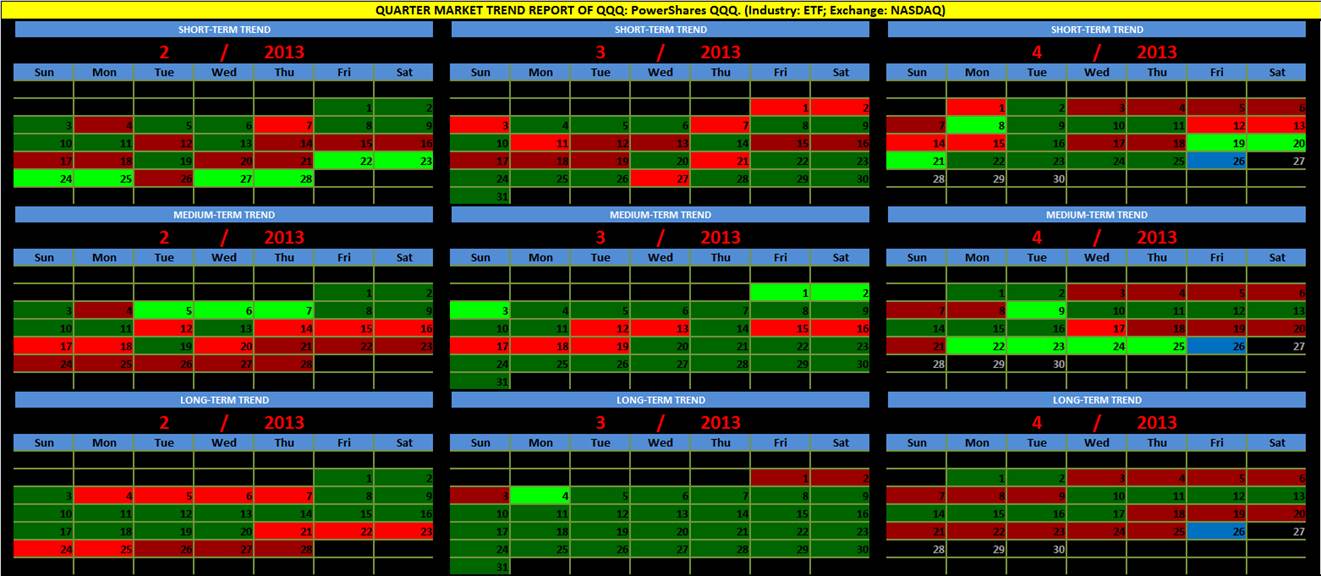
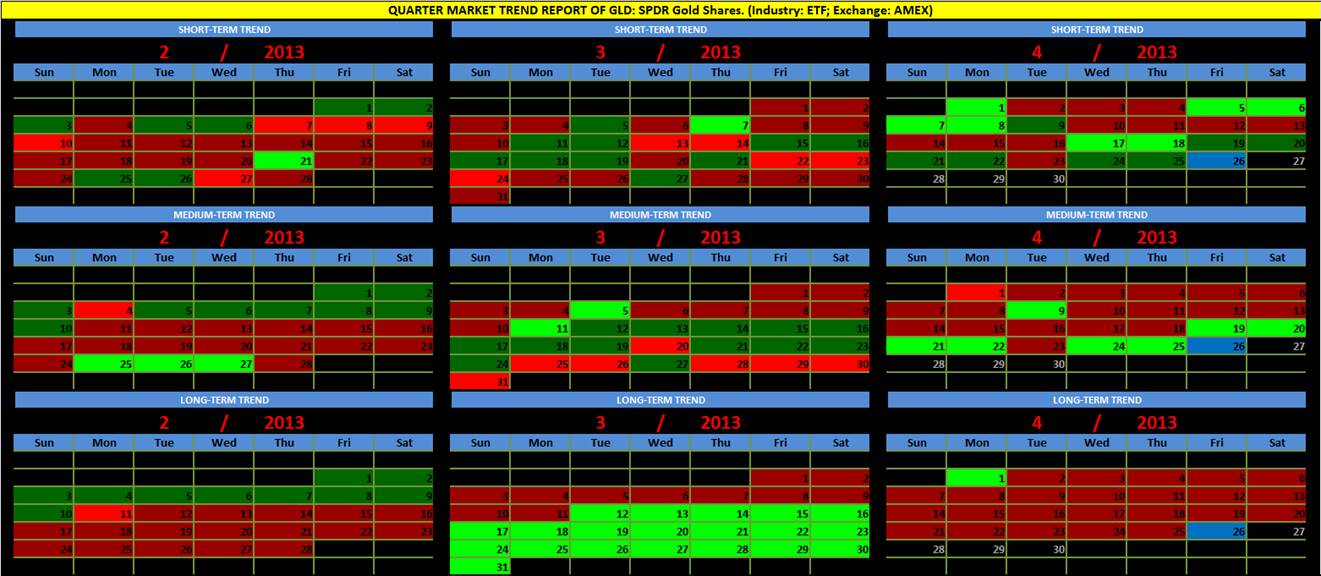
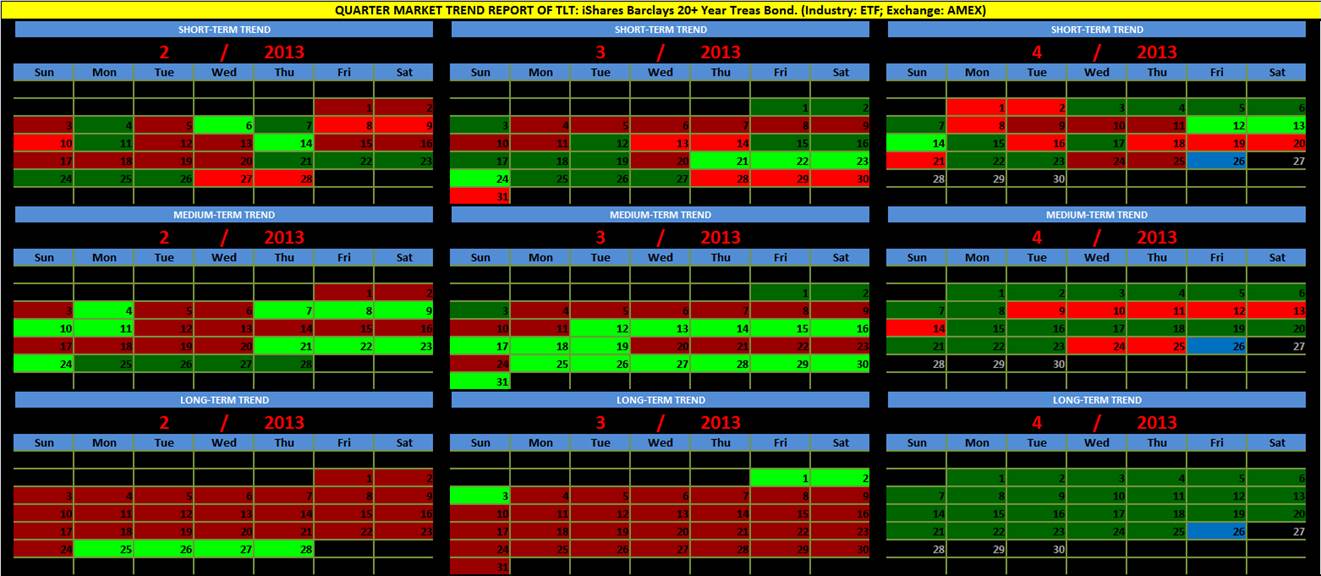
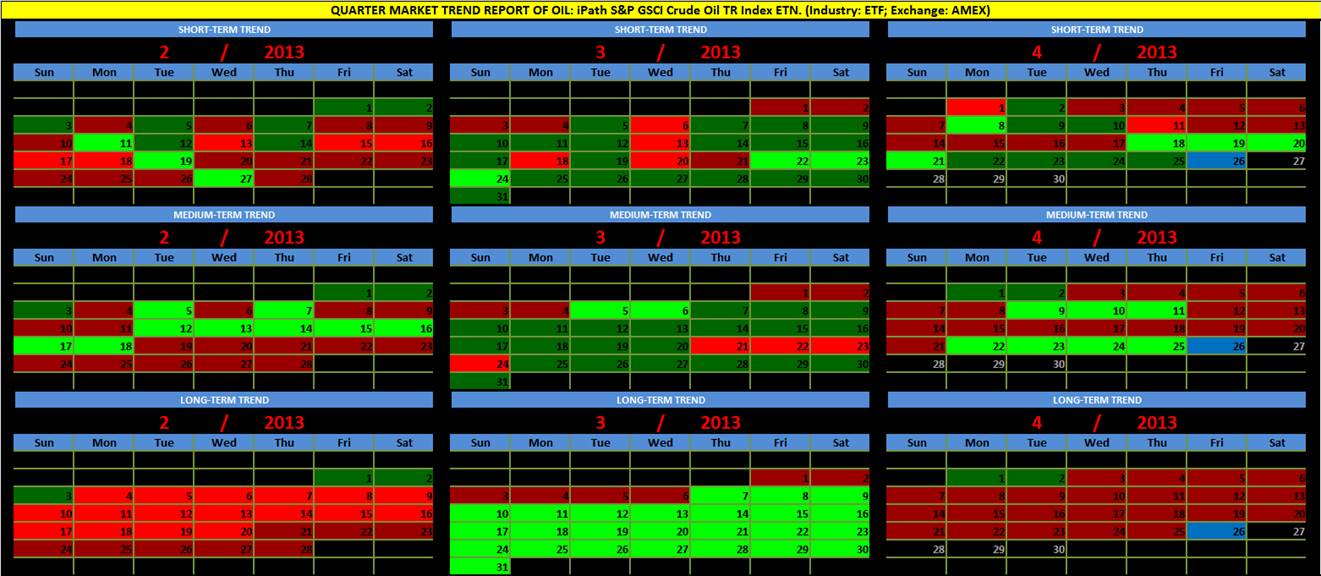
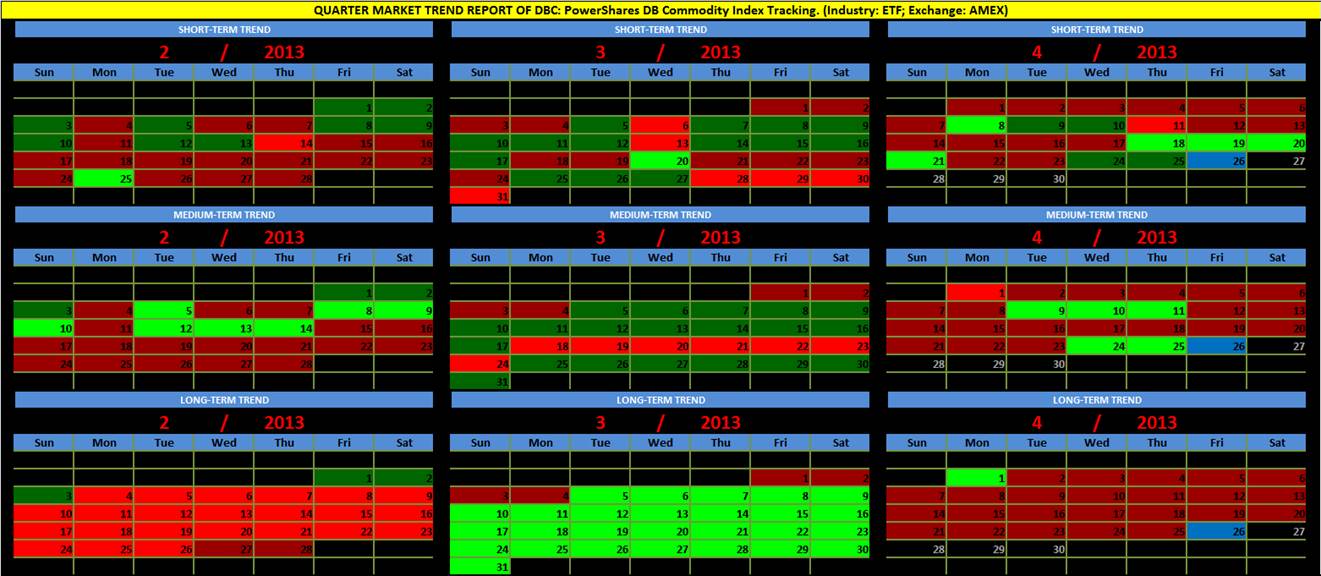
SPY, DIA, QQQ, GLD, TLT, OIL, & DBC (Exchange-Traded Funds) Alert For April 25, 2013
THE BENCHMARKS:
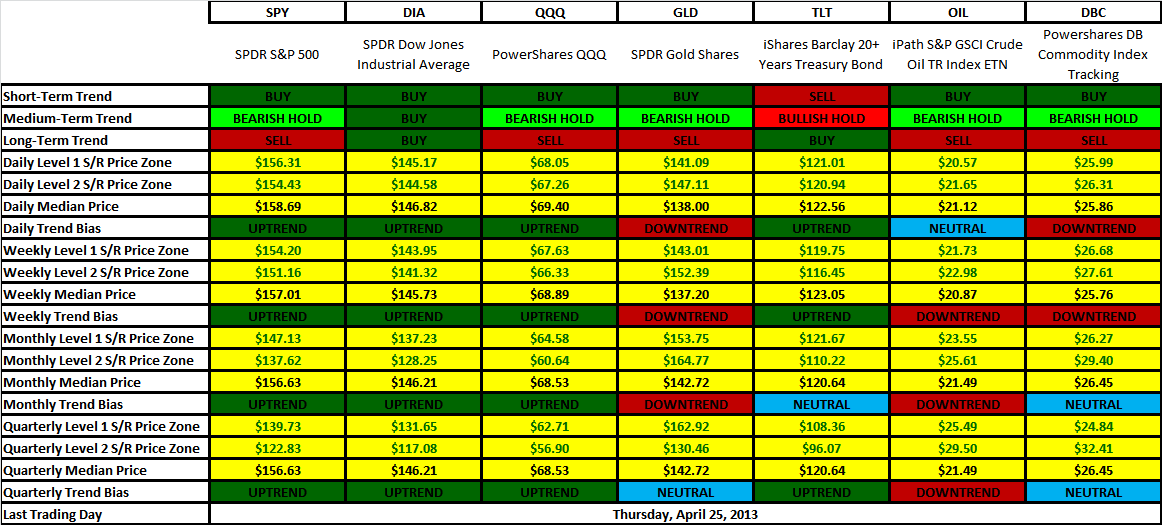
ARM 3T SITUATION REPORT ("BUY/HOLD/SELL"):
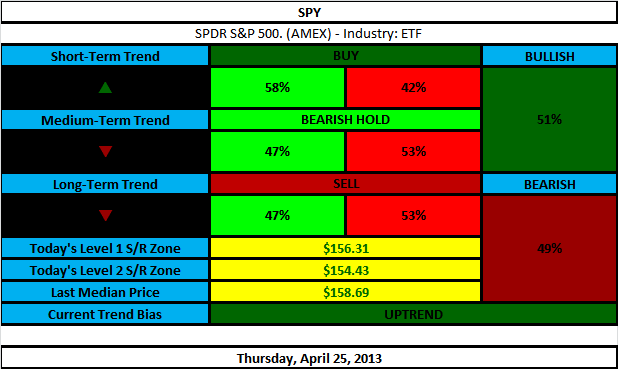
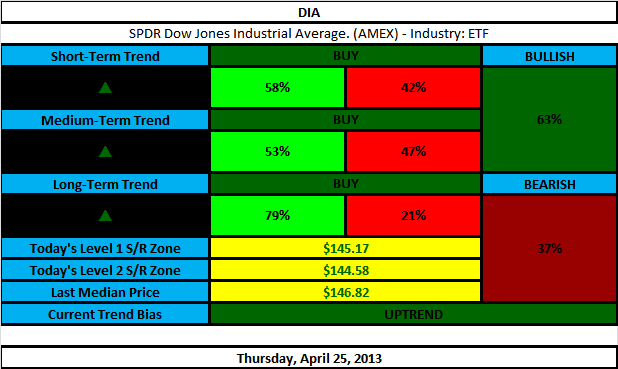


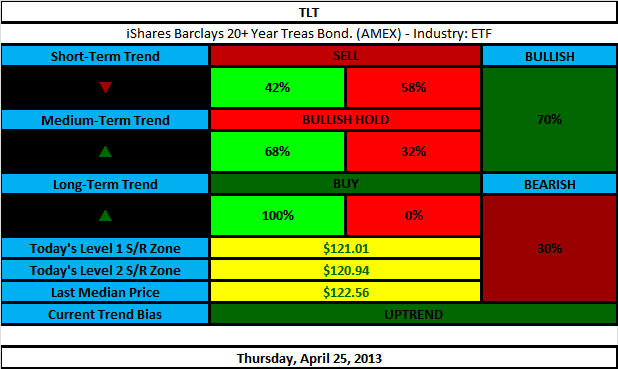
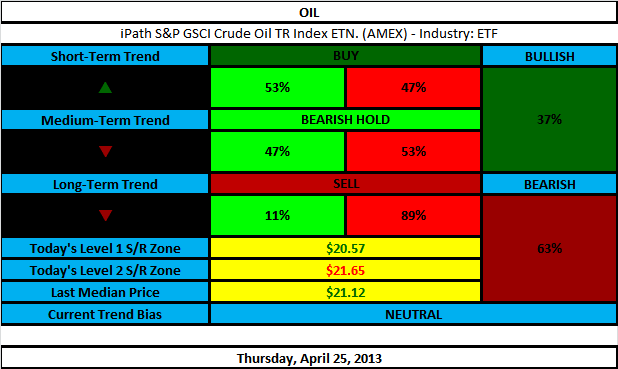
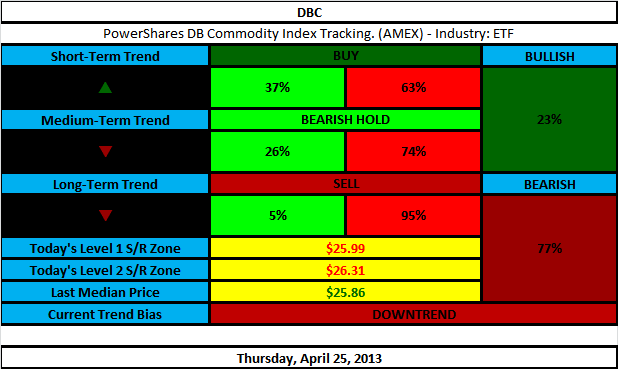
ARM 3T TREND™ ANALYSIS:


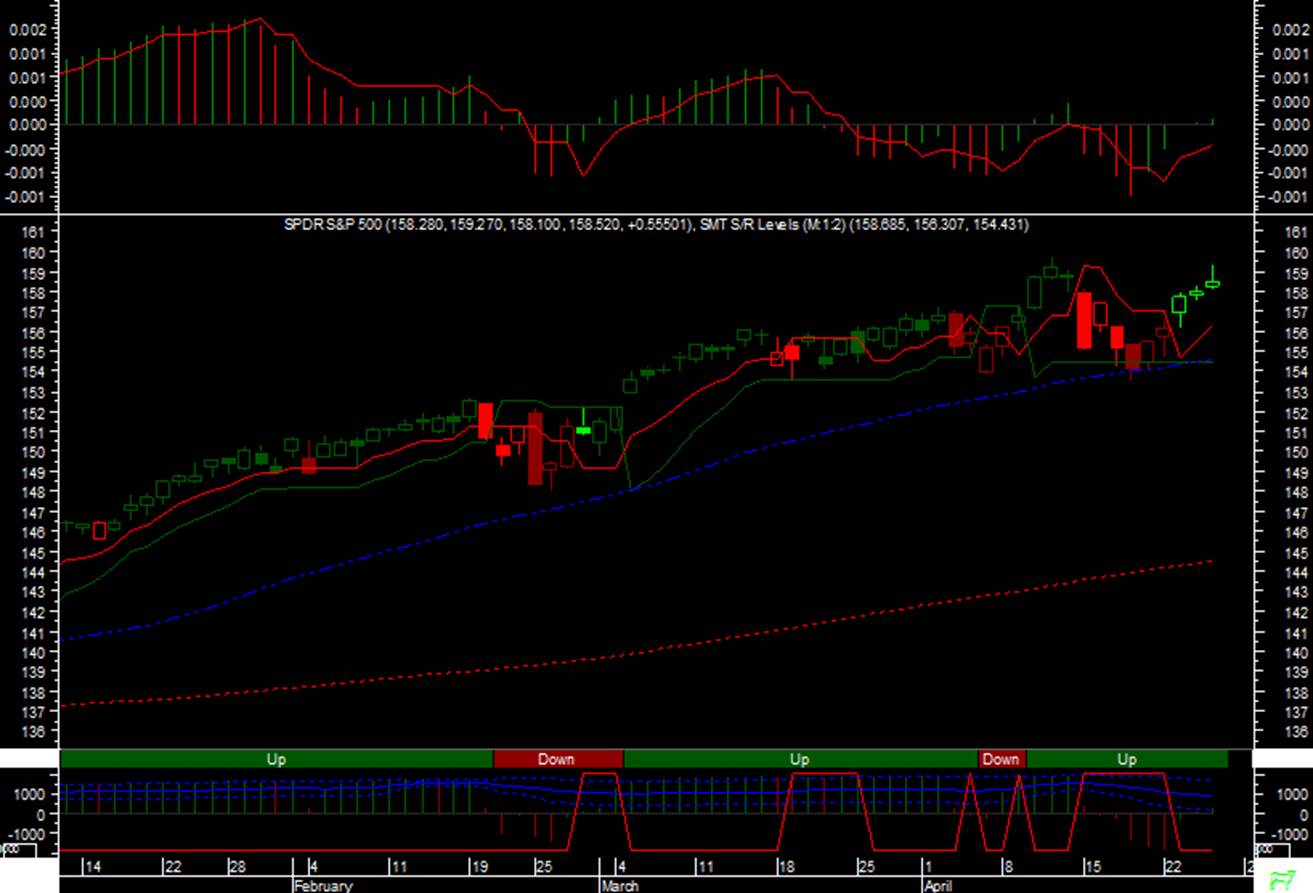
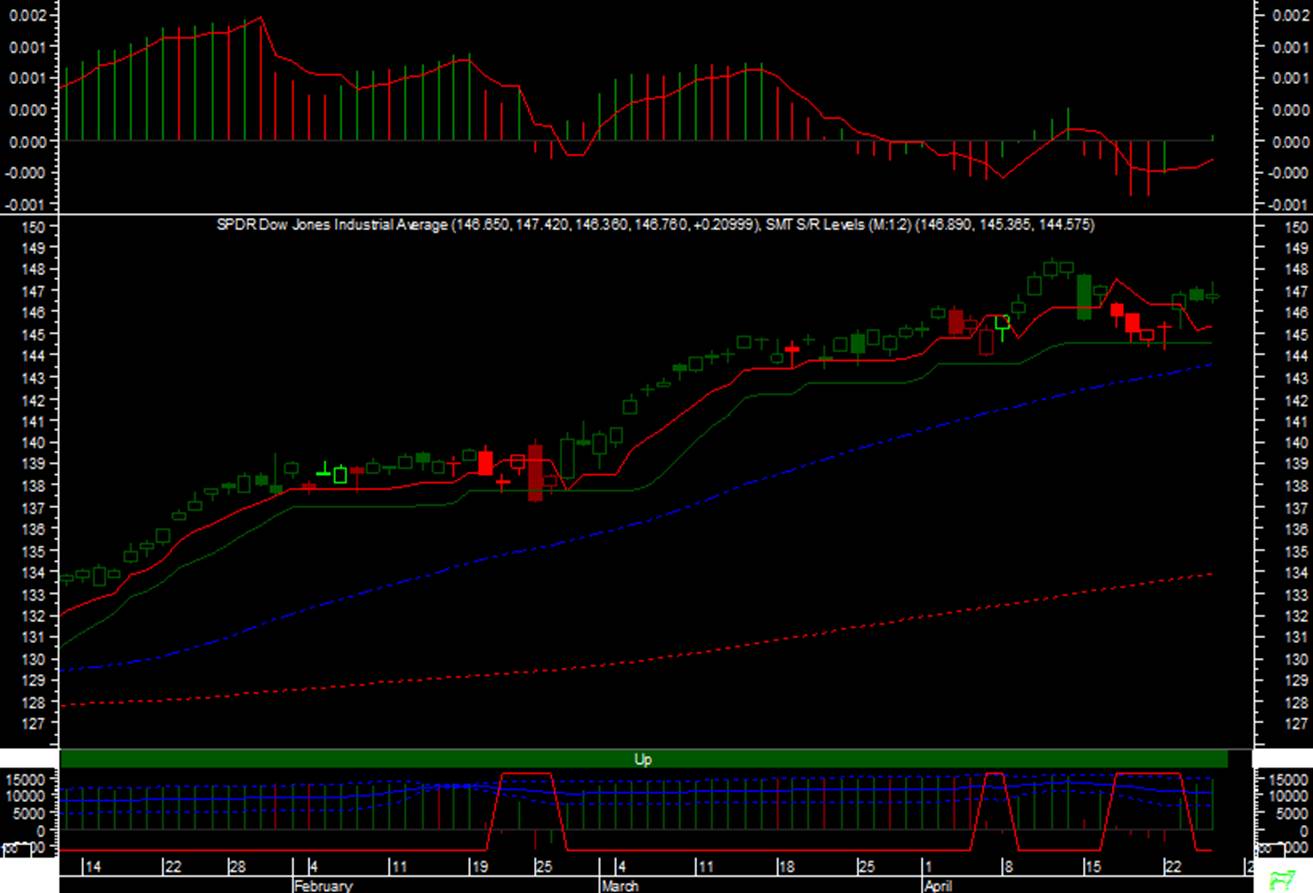
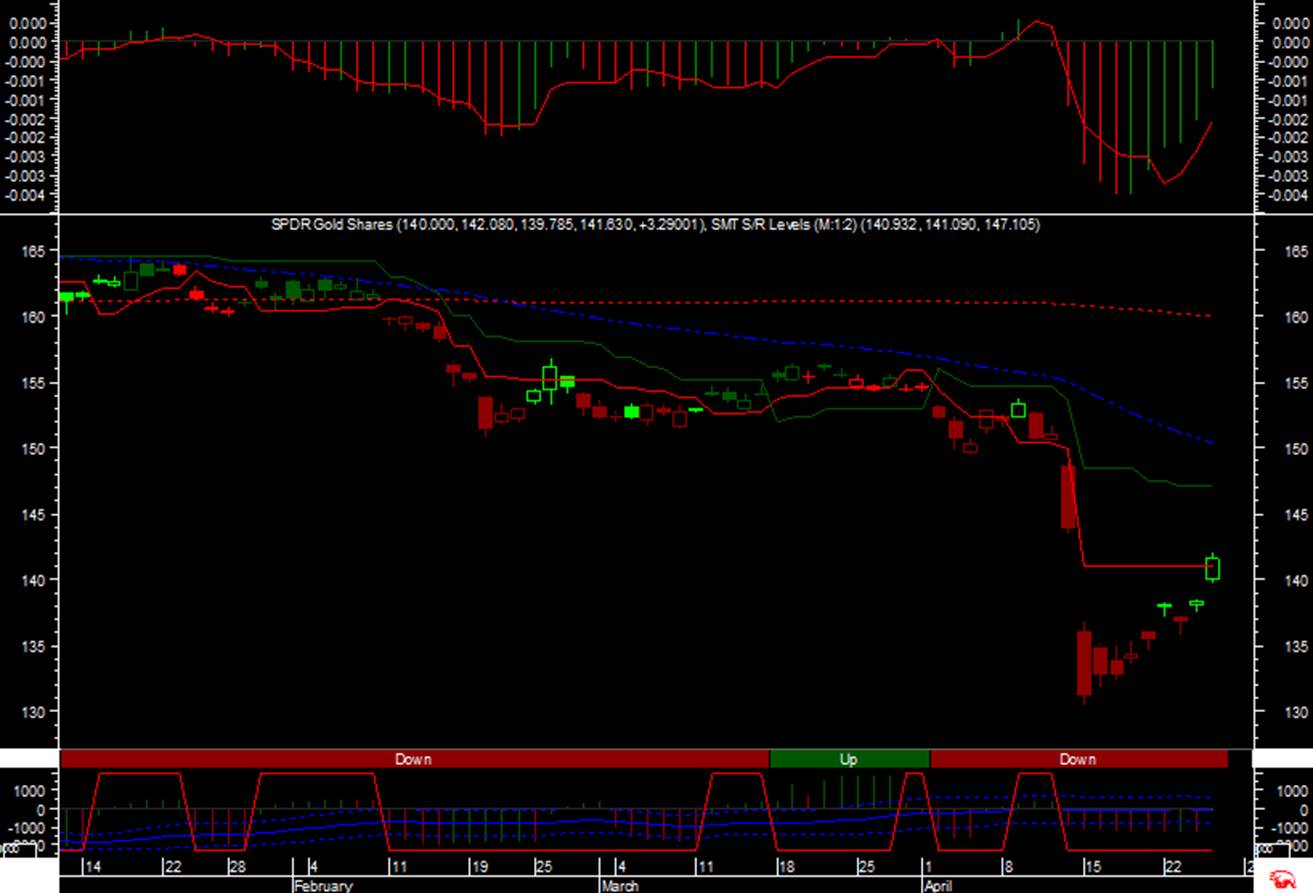
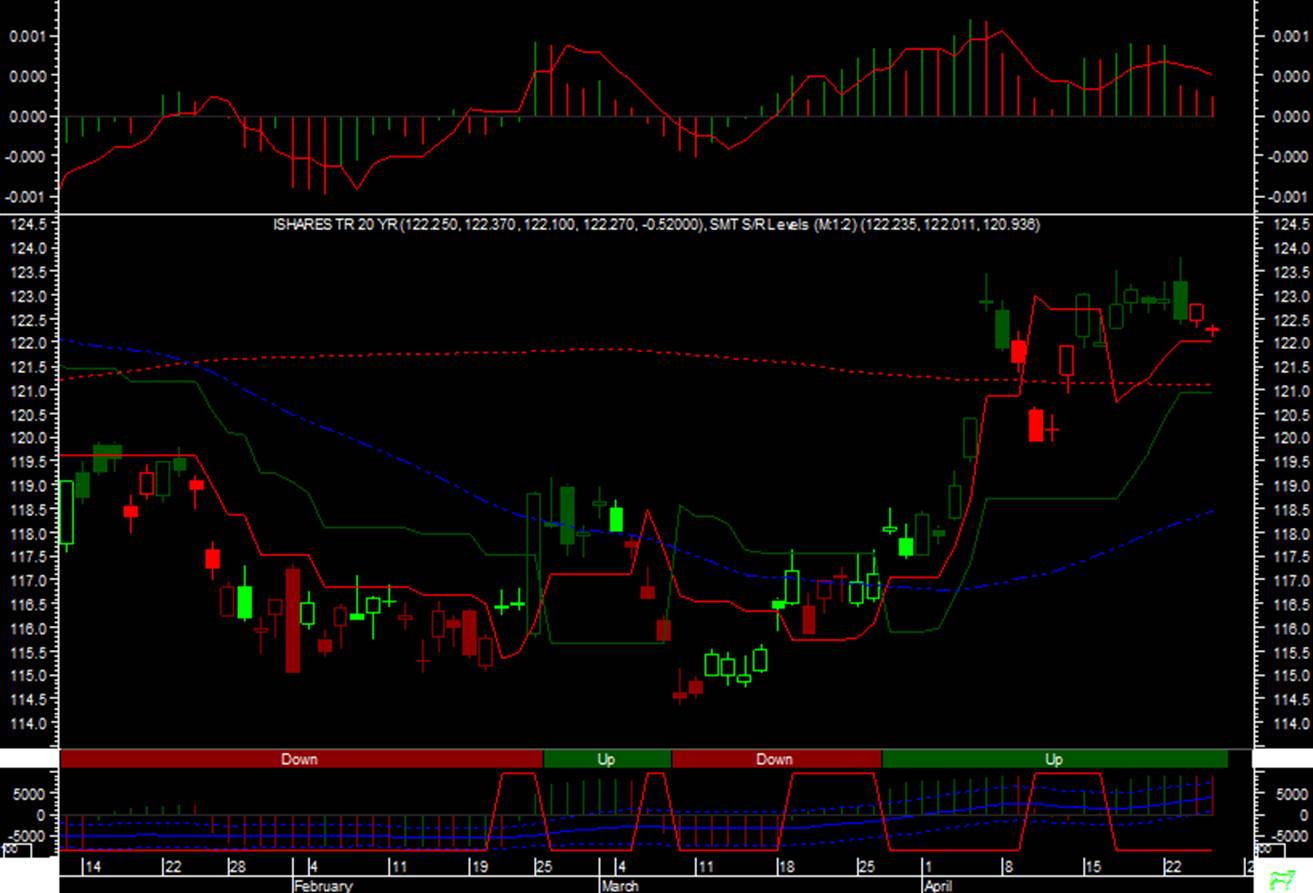
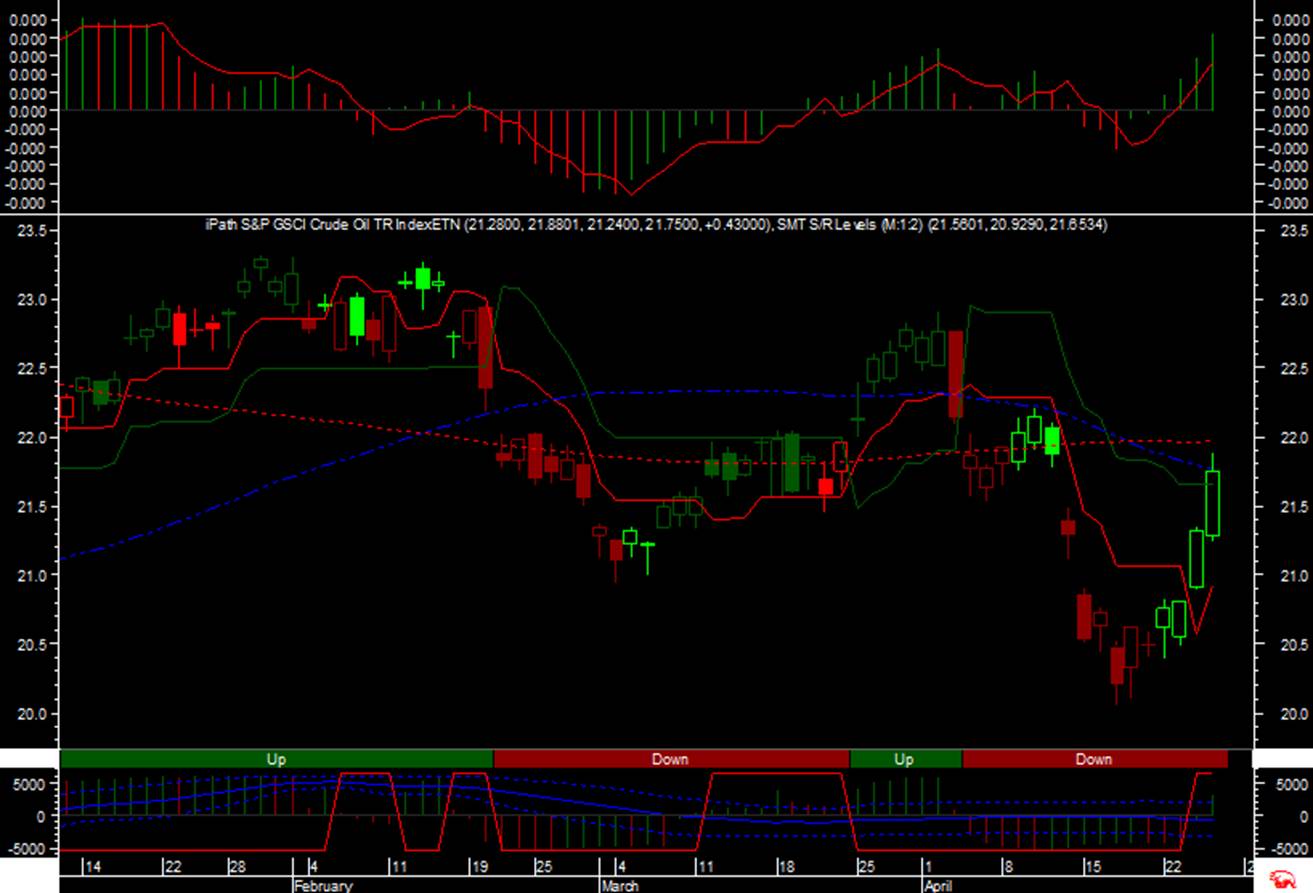
DAILY PRICE CHARTS w/ ARM 3T TREND ANALYSIS (MEDIUM-TERM TREND) POWERED BY METASTOCK®:


Notes:
- ARM 3T Trend Analysis™ powered by Microsoft© Excel® 2010.
- Red solid line within stock charts signifies Level 1 S/R Price Zone serving as a specified price support/resistance level.
- Green solid line within stock charts signifies Level 2 S/R Price Zone serving as a specified price support/resistance level.
- Yellow solid line within stock charts signifies Level 3 S/R Price Zone serving as a specified price support/resistance level.
- Stock charts have three window panes: Top (proprietary momentum and S/R Level indicators); Middle (Candlestick Price Bars with medium-term ARM 3T Trend Analysis™ powered by Thomson Reuters MetaStock® version 9.0 within Daily price charts along w/ Blue 50-SMA, Red 200-SMA, and S/R Levels indicator); and Bottom (proprietary volume oscillator indicator with volatility indicator and neutral trend bias indicator).
Disclosure: I have no positions in any stocks mentioned, and no plans to initiate any positions within the next 72 hours.