I became interested in gold around the year 2002 because of the long stagnation in price and the aggressive monetary policy being implemented at the time. I was a teaching assistant in an accounting class at university and we had a stock market contest. I recommended that one of my student's select a gold stock and since the teaching assistant's were allowed to participate as well, I selected one. Both our stocks were up 40% in 3 months. Having caught the gold bug, I began doing further research on the metal.
After graduating I read an investment piece by Barton Biggs that highlighted the case for gold. The work wasn't his own, he was in fact passing along some of the analysis of a former colleage whom gained some notoriety by convincing the firm that put option prices were extremely cheap in late 1987. The volatility smile was born shortly thereafter and this individual secured himself a nice opportunity to set out on his own for his contribution to finance. Unfortunately, I can't remember this individual's name, but he founded a small firm that dedicated itself to gold market research. One of the key insights this individual had was that gold performed well in times of negative real interest rates. Seems obvious in 2010, but this relatively simple analysis with some other supporting facts turned me into a gold bull in 2003. As a recent college grad with plenty of debt, I had limited means to express a view on gold, but in 2004 I purchased about 2.5 ounces of gold at the equivalent of $390 an ounce. My opinion on why gold has performed well over the past 10 years is far more nuanced than it was at the time which is to say I don't think I saw all the risks but this is the genesis of my interest in gold and should establish some background for my current view.
About two years ago, I turned my attention back to the gold market because based on intuition it seemed it was becoming overpriced. Gold wasn't popular in 2002, but by 2008 there were regular ads on TV for gold and it was a common conversation piece. My car mechanic recommended buying gold and storing it in Australia. Having entered the financial markets during the tech wreck, it's impossible for me to not question anything where the positive zeitgeist has become so palpable.
You often hear people say the dollar as a cash instrument is worthless -- not literally worthless, but that it provides a very poor, even negative return. This is one of the core arguments today for gold, essentially that it is the anti-dollar. In keeping with this thinking, it occurred to me compare gold to cash over a long period of time. I also added a couple other comparisons which cash investors often look at. To set the stage, here is the chart:
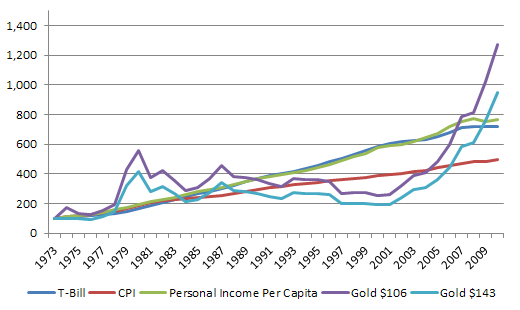
Let me explain the above graph. It is a comparison between five time-series all re-indexed to a 100 start point. I have estimated year-end 2010 levels from those available mid-year 2010 in the case of CPI and personal income per capita, the current price of gold and an estimate of T-Bill interest through year-end which is effectively zero.
First, the cumulative return on 3-month T-Bills is charted in blue with an ending index value of $722.51. Second, the CPI is charted in red over the same period with an ending index value of 494.84. The CPI is an oft-maligned measure but my own view is that it measures what it was designed to measure quite well. What it does not measure is the additional costs added each year to a person's expenditures brought about by quality improvements and new products and services added to the economy. Without getting into the debate further, let me propose an alternative measure by suggesting that gold could be a hedge not just against the price level of goods available today, but also of goods available tomorrow. To get an approximate grasp of this I have taken personal income per capita which has risen to an index level of 768.44 and charted it in green. It is interesting that this level roughly approximates that of the returns on short-term interest.
Charting the price of gold for this exercise isn't as simple as it seems. The single biggest issue to address is the start date. If the starting price is low, it will look like gold is currently expensive. If the starting price is high the opposite will occur. Therefore, changing the start year can have a very large impact on the relative returns of gold. The price of gold was set at $35 until 1968, and under a two-tier system until 1971 which means the gold price isn't meaningful until after these dates. By 1973 gold was $106 and by 1980 it was $595.
To determine the start year I have looked at differences in the return on cash, the price level and gold from 1913 to the early 1970s. Here are some facts from that analysis. CPI increased 224% between 1933, the year gold was set at $35, and 1973. Gold increased 204% over the same period. If you go back four years earlier to 1929 before the deflation of the Great Depression when gold was $20.67 and the price level had been stable for almost 10 years, the gold return would have been 415% (1929 - 1973) while the increase in CPI would have been only 159%. Just looking at this data, it seems gold in 1973 was fairly priced if not overvalued based on the relative price levels prevailing at the time. I have also included a time-series which assumes the average price of 1973-1975 as the starting point, which at $143. This is a more generous starting point for gold. Let's be clear here before moving on. If an investor would have bought gold in 1929 and been able to keep it until 1973, they would have outperformed inflation by 256% based on a $106 gold price and 432% based on a $143 gold price.
Having set the stage, let me address the implications of the graph. By any measure on the above graph, even the baseline CPI figure, gold was undervalued in 2001. This I think goes a long way toward explaining its performance over the past 10 years. In 2010, it seems the story has reversed. Whereas holding T-Bills was the better course of action on average from 1973 to 2006, now gold firmly has the upper hand. Furthermore, gold has vastly outperformed since 2001.
We should be cautious in drawing too many conclusions from such a simple analysis. For example, the cost inputs in the production of gold are not aligned well with the CPI. Gold mining is energy intensive and it could be that gold is following the price of oil more than the general price level. While the economy has become less energy intensive, the gold price may not have. In fact, it may have become more energy intensive. Gold may have shifted from being a hedge against generalized inflation, to that of energy inflation. This analysis also does not address the future: gold can be overvalued today, but based on future inflation and wage growth it may not.
To conclude, I think looking at an analysis such as this is just one part of the picture. The best lesson I can draw from it for my own trading is that today it is likely that gold is more of a symmetrical bet on the future course of inflation which wages and interest will follow, rather than a value investment in an unloved fundamentally undervalued asset. As an investment, gold has changed -- it is not the same investment it was 10 years ago. That does not in itself make it a bad investment.
Disclosure: Long a de minimus amount of physical gold.
Gold Price Analysis
Seeking Alpha's Disclosure: Past performance is no guarantee of future results. No recommendation or advice is being given as to whether any investment is suitable for a particular investor. Any views or opinions expressed above may not reflect those of Seeking Alpha as a whole. Seeking Alpha is not a licensed securities dealer, broker or US investment adviser or investment bank. Our analysts are third party authors that include both professional investors and individual investors who may not be licensed or certified by any institute or regulatory body.