The stock market's pre-holiday surge made for a nice long weekend for those who were long, but those on the sidelines are likely getting more frustrated and impatient. This type of environment can often lead to poor investment choices as patience is one of the key traits of successful investors.
The sentiment data from the AAII, taken before the July 3 close, revealed that only 38.5% are bullish. This is down from over 44% on June 12 and, since then, the Spyder Trust (SPY) is up 2.4%.
The weekly NYSE Advance/Decline made another new high last week and, while a pullback is possible at any time, there are no signs yet of a significant correction. The divergence in the Nasdaq 100 A/D line was resolved with Thursday's close as it surged to new highs (see chart).
The 3rd quarter pivot point analysis is positive for the majority of the sector and market tracking ETFs but some are quite extended at current levels. Be sure to keep your eye on the quarterly resistance levels. A 1-2% pullback would not cause much change in this analysis but it would be painful for those who just bought.
These two technology stocks are well below their 52-week highs but the volume analysis indicates that these stocks are being accumulated. Both need a slight pullback into last week's range, but if they do, the risk/reward on the long side is favorable.
Click to Enlarge
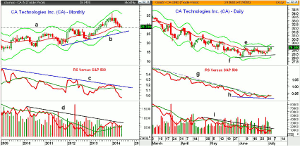
Chart Analysis: CA Technologies (CA) is a $413 billion dollar business software company that has a current yield of 3.5%. CA is down 18.9% from its 52-week high of $36.22.
- The monthly chart shows that it formed a doji in June as it retested the 2012 high, line a.
- A July close above $29.47 would trigger a monthly high close doji buy signal.
- The quarterly pivot is at $29.52.
- The monthly starc+ band and long-term support (line b) are in the $25.40-$25.60 area.
- The monthly relative performance is in a long-term downtrend, line c, and is well below its WMA.
- The OBV closed back above its WMA in June triggering an AOT buy signal.
- Once below the June low of $28.01 there is further support from last June at $27.09.
The daily chart of CA Technologies (CA) shows that it is just above its rising 20-day EMA at $28.94.
- The daily chart shows that there is also short-term resistance in the $29.47 area, line e.
- The daily starc+ band is at $29.79 with further resistance at $28.
- The quarterly projected pivot resistance is at $30.94.
- The daily chart shows a potential bottom formation, line f, with support at $28.10-$28.38.
- The daily relative performance has broken its downtrend, line g, and closed Thursday just above its WMA.
- A strong move above the June high will indicate it is a market leader.
- At the most recent low there was one high volume today so the OBV is still just barely below its WMA.
- The OBV needs to move above its downtrend, line i, to turn positive.
Click to Enlarge
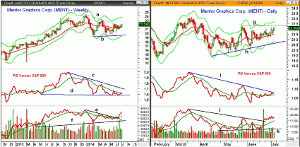
Mentor Graphics Corp (MENT) is a $2.51 billion technical and system software company that is 9.3% below the 52-week high of $24.31.
- The weekly chart shows that it has just closed above the downtrend, line a, as it tested the monthly pivot ($21.23) last week.
- The March swing high was at $23.04 with the December high at $24.20.
- The 127.2% Fibonacci retracement target from the recent continuation pattern (lines a and b) is at $25.62.
- The relative performance appears to have significantly tested long-term support at line d. The RS line is still just below its WMA with more important resistance at line c.
- The weekly OBV has surged to the upside over the past three weeks as it has moved through resistance at line e.
- The OBV is well above its rising WMA and longer-term support at line f.
- There is monthly projected pivot support at $20.46.
The daily chart of MENT also looks positive with near term resistance, line g, now at $22.27.
- The daily chart has near term support at $20.87-$21.19.
- The quarterly pivot is at $21.16.
- The daily starc- band is at $20.87 with further support at line h.
- The RS line has been holding above its WMA for the past two weeks and it is now testing the downtrend, line i.
- The daily OBV broke through its downtrend, line j, on June 20, as volume surged.
- It is well above its WMA with stronger support at line k.
What it Means: The weekly studies on the technology sector broke out to the upside last week suggesting that it may be ready to catch up with the overall market.
These two stocks have significant upside potential as CA Technologies (CA) is down 11.2% this year while Mentor Graphics Corp (MENT) is down 8.2%. The key, of course, is the entry as I discussed in a recent trading lesson Advanced Entry Techniques for Any Market
How to Profit: For CA Technologies (CA) go 50% long at $29.03 and 50% at $28.67 with a stop at $27.93 (risk of approx. 3.2%).
For Mentor Graphics Corp (MENT) go 50% long at $21.85 and 50% at $21.57 with a stop at $20.83 (risk of approx. 4.3%).
Disclosure: The author has no positions in any stocks mentioned, and no plans to initiate any positions within the next 72 hours.

