Even though Wednesday's economic data was mixed, the stock market did not seem to care as stocks continued higher after Tuesday's upside reversal. The market breadth was 2-1 positive, so the short-term momentum remains positive.
The S&P 500 was up just 0.38%, while the small-cap Russell 2000 was up 0.90%. The market analysis of the iShares Russell 2000 (IWM) shows signs that it may be ready to breakout to the upside. New longs were recommended for traders via a Tweet before the opening.
Rare comments by Amazon.com's Jeff Bezos at the Business Insiders Ignition Conference on his successes and failures increased the market speculation on where the stock might go in 2015.
The sharp 20-minute drop in Apple's stock-from $119.16 to $111.27-early Monday, also got the market's attention. Though there are a few more skeptics now on AAPL than there were a few years ago, the bulls still dominate as one just raised his target for the stock from $135 to $150.
The surprising 27% increase in eBay's Black Friday's online sales-when combined with a 24% from Amazon.com-has fueled the debate between the bulls and the bears. This raises the question on whether these three stocks should be part of your portfolio as we head into 2015.
Click to Enlarge
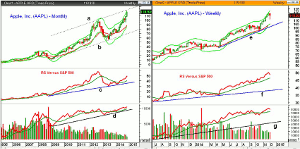
Chart Analysis: The monthly chart of Apple, Inc. (AAPL) clearly illustrates the powerful rally from the April 2013 low of $52.87.
- The November close was above the monthly starc+ band at $115.41.
- The daily starc+ band is now at $122.04 and the upper trading channel is at $124.76.
- The monthly projected pivot resistance is at $127.41.
- The monthly relative performance moved back above its WMA in April 2014.
- The RS line is still rising strongly but is still below the 2012 highs.
- The monthly OBV has confirmed the price action and is clearly positive.
- There is first good monthly support in the $93-$94 area.
The weekly chart of AAPL is updated through Wednesday and shows Monday's drop and the ensuing rebound.
- The weekly starc+ band has been tested over the past three weeks and is at $123.47 this week.
- The October pullback in AAPL held the rising 20-week EMA and turned out to be an excellent buying opportunity.
- AAPL is up over 22% from the October lows.
- The weekly relative performance still signals that AAPL is a market leader as it made new highs last week.
- The weekly OBV looks ready to turn down this week, but also confirmed the new highs.
- It is well above the rising WMA with more important support at the October lows.
- Monday's low came close to the monthly projected pivot support at $110.47
- The 50% retracement support from the recent highs is at $107.43.
Click to Enlarge
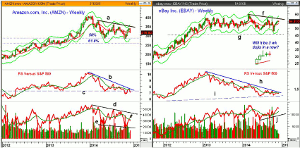
The weekly chart of Amazon.com Inc. (AMZN) shows that it again dropped slightly below the 50% Fibonacci support at $287.
- AMZN, as of Wednesday's close, was down over $22 for the week and a close at current levels or lower will increase the pressure on the downside.
- AMZN is currently trading below the 20-week EMA and the quarterly pivot at $330.63.
- The monthly projected pivot support is at $306.87.
- A weekly close below the $300 level would be even more negative.
- As I noted earlier in the year, the relative performance broke long-term support, line c, in October.
- The RS line shows a pattern of lower highs, line b.
- The weekly OBV just barely made it back above its declining WMA last week.
- It is likely to drop back below the WMA with Friday's close, generating an AOT sell signal.
- The weekly OBV has also made lower lows, line e, and needs to overcome the resistance at line d, to turn positive.
- The weekly downtrend, line a, is now at $347.68.
eBay Inc. (EBAY) hit a low of $46.34 in October (line g) and hit a high three weeks ago of $55.66. It is flat for the year even after gaining 4% in the past month.
- The past two weeks, EBAY has formed dojis and could form another this week.
- A weekly close below $54.23 will trigger a weekly LCD sell signal.
- EBAY opened Monday at $54.76 and it closed Wednesday at $54.81.
- This is just above the quarterly pivot at $54.56, which could be broken on a weekly closing basis.
- The 20-week EMA is at $53.16 with the monthly projected pivot support at $52.89.
- The relative performance peaked in early 2013 and has been in a well established downtrend, line h, ever since.
- The RS line is trying to hold above the long-term support at line i.
- The weekly on-balance volume (OBV) shows a positive pattern of higher highs and higher lows and is well above its WMA.
- The OBV has more important support at line j.
- The daily OBV (not shown) is just slightly below its flat WMA.
What it Means: The technical outlook for Apple, Inc. (AAPL) is the most positive across all time frames. The tough part is the entry as the closest stop would have to be under the $100 level. I would not be surprised to see a drop to or below Monday's lows in the next few weeks and I will be looking for an entry point.
Amazon.com Inc. (AMZN) and eBay Inc. (EBAY) both look vulnerable technically, even though AMZN is still a favorite of most shoppers. If AMZN tests and again holds the October lows in the first quarter of 2015, it would be more interesting.
How to Profit: No new recommendation.

