The S&P 500 Index closed on Friday at 1,948.05, up 1.16% on the week. On Thursday the market closed above the key 1,950 resistance level on the S&P 500 Index and then extended that rally on Friday morning where it ran into resistance at 1,963. This 50% retracement level of the decline that ended on February 11th at 1,810 proved formidable and the subsequent close below 1,950 leaves us in a quandary.
The continuing strength in Chaikin Money Flow for the S&P 500 ETF (SPY), along with the bullish divergences that accompanied the bottom at 1,810 suggest that after a brief consolidation from overbought levels, the stock market may have enough oomph to break through resistance and trade up to 2,000 - 2,050.
Put some cash to work in bullish Power Gauge stocks on pullbacks of 1 ½ - 3% in the overall market.
Volatility Fueled by Swings in Crude Oil and Mixed Economic Reports
Last week was emblematic of the chaotic and unpredictable nature of the current market environment. While the U.S. stock market seems to have shaken off concerns about the Chinese economy, we are still tied very closely to the wild swings in the price of crude oil.
Economic reports last week were mixed, with some indicating a strengthening economy and rising wage and inflation pressures, while others still pointed to softness in the industrial sector. Complicating the picture, and contributing to market volatility, is the impact of these bullish economic reports on the Federal Reserve Board's interest rate decisions in their March and June meetings. The 10-year Treasury bond and the action of the bank stocks last week, reflect these ambiguities, with treasuries selling off while financials did better, as economic reports indicated a strengthening economy.
The stock market decline after the first Fed rate hike in December was in line with past market actions, which also suggested the rally we are now experiencing. Whether the market will put a positive spin on a future rate hike that reflects a stronger economy remains to be seen.
For now, the market appears to have put in another "W" bottom and has rallied to a short-term overbought condition. This week we have an opportunity to see a follow through to the upside after early consolidation of the past 2 week's rally.
Charts of the S&P 500 Index
The chart of the S&P 500 Index ETF below, shows the 2 key resistance areas, 1,950 and 2,000 for the S&P 500. The market rally above 1,950 on Friday but ran into resistance at the 50% retracement level of 1,963, falling below 1,950 on Friday's close.
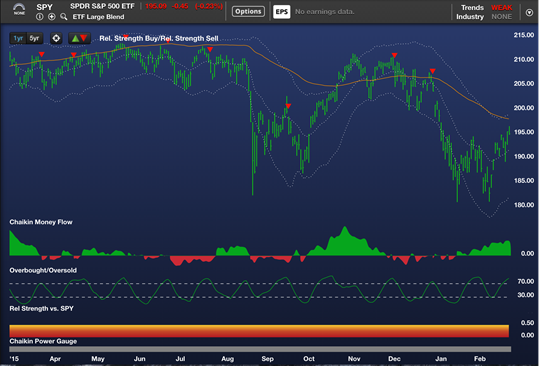
The bearish pattern of lower highs and lower lows, which dates back to April of 2015 has been broken and Chaikin Money Flow remains strong which suggests limited pullbacks and a renewed rally attempt which could take us up to 2,000 and beyond.
Also positive is the action of the Guggenheim equal-weighted S&P 500 ETF (RSP) which has begun to outperform the SPY in the short-term. This indicates that the smaller cap stocks in the S&P 500 Index are outperforming the FANG stocks (Facebook, Amazon, Netflix, Alphabet (GOOGL) and their other mega-cap brethren. This is an early indication of a healthier market climate.
As the intra-day chart of the S&P 500 Index below shows, the stock market briefly broke below 1,900 on Wednesday's opening but staged a sharp rally which broke the bearish pattern of lower highs and lower lows. The rally did, however, run into resistance at 1,963, which marked a 50% retracement of the advance that began at the February lows, closing Friday below the key 1,950 resistance level.
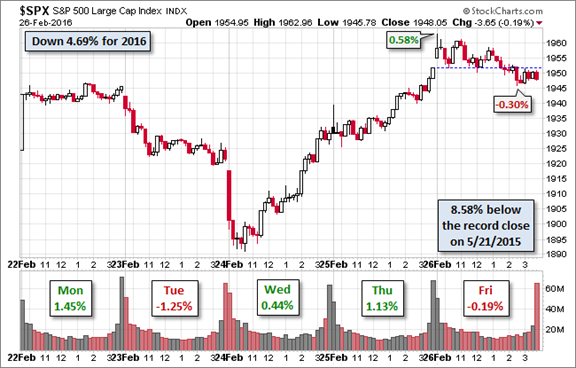
Chart courtesy of Doug Short at Advisor Perspectives
Power Bar differentials for the Major IndexesThe Power Bar differentials for the S&P 500 Index , Nasdaq 100 (QQQ) and the Russell 2000 small cap index (IWM) all showed an improvement this past week. The smallest improvement was in the QQQs with the Nasdaq 100 starting to underperform the S&P 500 Index.


Image from Chaikin Analytics for Desktop © 2015
For more market insights, subscribe to PowerSuite Premium, which includes Marc Chaikin's weekly stock market analysis report, Market Insights.
Disclaimer: Chaikin Analytics LLC is not registered as a securities broker-dealer or advisor either with the U.S. Securities and Exchange Commission or with any state securities regulatory authority. Chaikin Analytics does not recommend the purchase of any stock or advise on the suitability of any trade. The information presented is generic in nature and is not to be construed as an endorsement, recommendation, advice or any offer or solicitation to buy or sell securities of any kind, but solely as information requiring further research as to suitability, accuracy and appropriateness. Users bear sole responsibility for their own stock research and decisions. Read the entire disclaimer.