| OSS Nightly Stats These are not recommendations.
Buy and Sell signals are sent to Option Signal Service subscribers. Not signed-up for the Free weekly newsletter?
Sign-up here | Did you know you can have the subscriber version of the OSS NIGHTLY STATS e-mailed directly to your in-box with a subscription to the OSS INDICATORS newsletter? The subscriber version contains charts of potential trades for the next day! Check out some past OSS INDICATORS newsletters. Click Here |
Best Market Timers For 2013
Guess who won 2nd place?
Click Here |
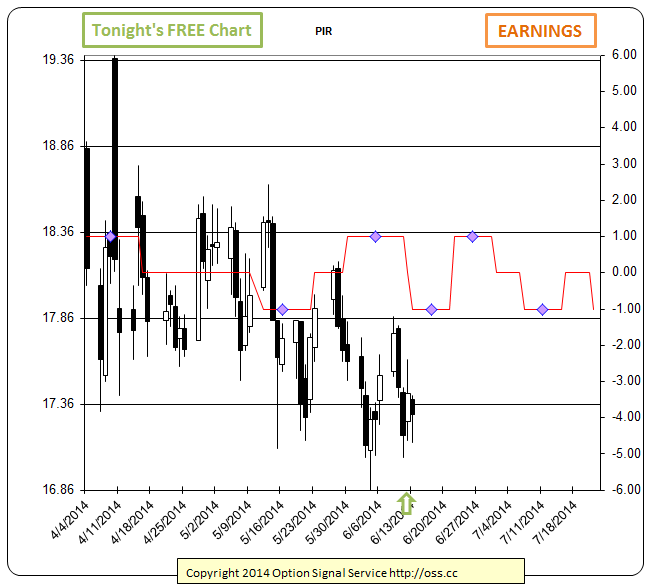
Thoughts & Comments- Expecting more to the down side with a possible rally on Friday.
Stock & ETF Fund To Date 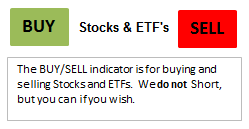 | | Trades: | 38 | Profit: | 107.37% | | Winners: | 36 | Losers: | 2 | |
 | Emini Trades (last 5 days) | | Date | Scalpers | Profit | Sluggers | Profit | Chart | | 6/10/2014 | +1.5, | 1.50 | +1.5, | 1.50 | | | 6/4/2014 | -2 | -2.00 | -2 | -2.00 | | | 5/30/2014 | -1, +0.5, -0.5 | -1.00 | -1, +0.5, -0.5 | -1.00 | | | 5/28/2014 | +2, -2, +0.75, +1.5, -1 | 1.25 | +2, -2, +0.75, +1.5, -1 | 1.25 | | | 5/27/2014 | -2, +1 | -1.00 | -2, +1 | -1.00 | | | Past trding results can be found here at the bottom of the page. |
| Option Trades Closed Today | | Ticker | Option | ENTRY | BUY$ | EXIT | SELL$ | % | | F | JUN14 17 PUTS | 09/06/14 | $0.18 | 12/06/14 | $0.37 | 100% | | VXX | JUN14 31 CALLS | 11/06/14 | $0.80 | 12/06/14 | $1.60 | 100% | | Past results can be found here at the top of the page. |
| Stock Trades Closed Today | | TICKER | ENTRY | BUY$ | EXIT | SELL$ | PROFIT | % | | UNG | 11/06/14 | $25.20 | 13/06/14 | $26.20 | $1.00 | 3.97% | | ^VIX | 06/05/14 | $13.95 | 13/06/14 | $12.45 | ($1.50) | -10.75% | | Past results can be found here at the top of the page. |
| Closing Prices | | Ticker | Open | High | Low | Close | Chg Pts. | Chg% | High Pts. | High% | Low Pts. | Low% | | ^OEX | 854.64 | 857.98 | 853.91 | 857.19 | 2.72 | 0.32% | 3.51 | 0.41% | -0.56 | -0.07% | | ^GSPC | 1,930.80 | 1,937.30 | 1,927.69 | 1,936.16 | 6.05 | 0.31% | 7.19 | 0.37% | -2.42 | -0.13% | | ^VIX | 12.45 | 12.69 | 11.89 | 12.18 | -0.38 | -3.03% | 0.13 | 1.04% | -0.67 | -5.33% | | IWM | 115.67 | 115.91 | 114.66 | 115.59 | 0.20 | 0.17% | 0.52 | 0.45% | -0.73 | -0.63% | | SPY | 193.90 | 194.32 | 193.30 | 194.13 | 0.59 | 0.30% | 0.78 | 0.40% | -0.24 | -0.12% | | GLD | 122.57 | 123.04 | 122.51 | 122.96 | 0.32 | 0.26% | 0.40 | 0.32% | -0.13 | -0.11% | | SLV | 18.78 | 18.95 | 18.77 | 18.92 | 0.16 | 0.85% | 0.19 | 1.01% | 0.01 | 0.05% | | UUP | 21.52 | 21.56 | 21.52 | 21.54 | 0.00 | 0.00% | 0.02 | 0.08% | -0.02 | -0.09% | | TLT | 111.57 | 112.62 | 111.53 | 112.15 | -0.06 | -0.05% | 0.41 | 0.37% | -0.68 | -0.61% | | USO | 39.08 | 39.28 | 39.02 | 39.12 | 0.04 | 0.10% | 0.20 | 0.51% | -0.06 | -0.15% |
| Tomorrow's Pivots | | Ticker | S2 | S1 | Pivot | R1 | R2 | | ^OEX | 852.29 | 854.74 | 856.36 | 858.81 | 860.43 | | ^GSPC | 1,924.11 | 1,930.13 | 1,933.72 | 1,939.74 | 1,943.33 | | ^VIX | 11.45 | 11.82 | 12.25 | 12.62 | 13.05 | | IWM | 114.14 | 114.86 | 115.39 | 116.11 | 116.64 | | SPY | 192.90 | 193.51 | 193.92 | 194.53 | 194.94 | | GLD | 122.31 | 122.63 | 122.84 | 123.16 | 123.36 | | SLV | 18.70 | 18.81 | 18.88 | 18.99 | 19.06 | | UUP | 21.50 | 21.52 | 21.54 | 21.56 | 21.58 | | TLT | 111.01 | 111.58 | 112.10 | 112.67 | 113.19 | | USO | 38.88 | 39.00 | 39.14 | 39.26 | 39.40 | | Candlestick Count -- Last 5 days | | Bullish | Bearish | | EG+ ... Engulfing | EG- ... Engulfing | | ST+ ... Morning Star | ST- ... Evening Star | | HA+ ... Harami | HA- ... Harami | | PP+ ... Piercing Pattern | DC- ... Dark Cloud | | | DATE | EG+ | PP+ | HA+ | ST+ | EG- | DC- | HA- | ST- | + | - | +% | | 6/13/2014 | 42 | 3 | 25 | 0 | 49 | 6 | 30 | 0 | 70 | 85 | 0.45 | | 6/12/2014 | 35 | 3 | 5 | 0 | 101 | 6 | 29 | 0 | 43 | 136 | 0.24 | | 6/11/2014 | 50 | 2 | 6 | 0 | 32 | 5 | 40 | 1 | 58 | 78 | 0.43 | | 6/9/2014 | 27 | 1 | 2 | 0 | 54 | 11 | 31 | 3 | 30 | 99 | 0.23 | | 6/9/2014 | 27 | 1 | 2 | 0 | 54 | 11 | 31 | 3 | 30 | 99 | 0.23 |
| Technical Analysis and Point & Figure Scores | | Date | TA+ | TA- | TA% | P&F+ | P&F- | P&F% | | 6/13/2014 | 2148 | 1335 | 0.62 | 1267 | 729 | 0.63 | | 6/12/2014 | 2078 | 1657 | 0.56 | 1293 | 728 | 0.64 | | 6/11/2014 | 2088 | 1309 | 0.61 | 1318 | 737 | 0.64 | | 6/9/2014 | 3470 | 1065 | 0.77 | 1323 | 747 | 0.64 | | 6/6/2014 | 4399 | 833 | 0.84 | 1242 | 778 | 0.61 |
| Earnings Announcements for Monday, June 16 | | Ticker | EPS | Time | Company | OSS Rating | | PIR | 0.20 | Time Not Supplied | Pier 1 Imports Inc |  |
| ** SUBSCRIBER'S ONLY SECTION ** Not a subscriber? Sign up now! Charts, Options and high probability trade setups. Click Here |
|