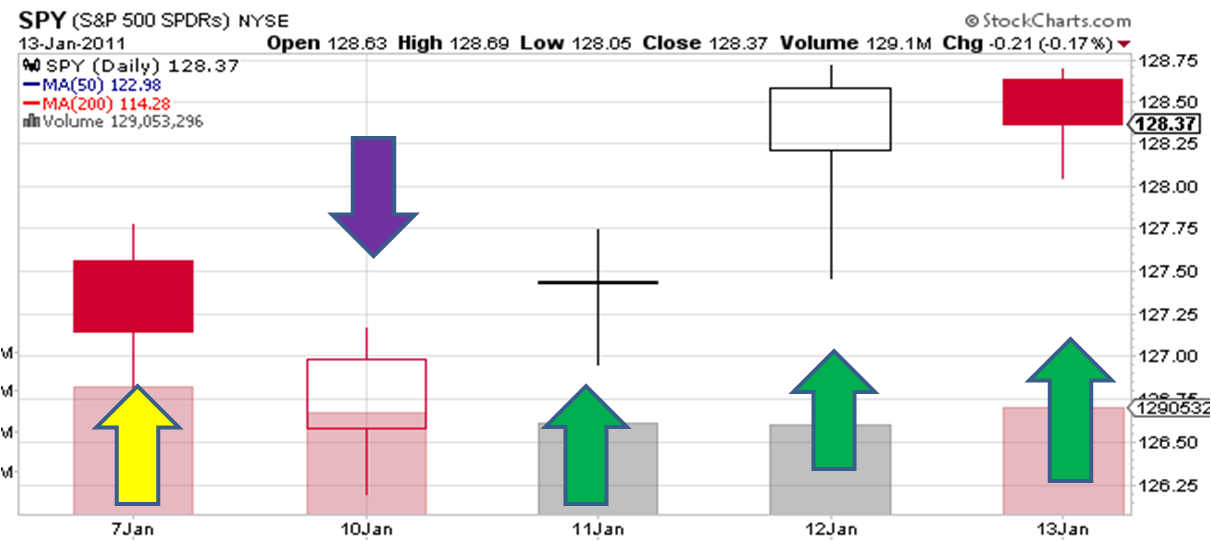
chart [ green arrow : uptrend high confidence | yellow arrow: uptrend low confidence ]
chart [ red arrow : downtrend high confidence | purple arrow : downtrend low confidence ]
Statistical Learning Models :
Neural Net Daily Trend Identifier : UP [0.95 confidence : High ]
Daily Short-Term Overreaction : DOWN [confidence : Low]
Filtering Model (4-hour frequency):
Main Trend : UP
Momentum : UP [increasing]
Mean Reversion (4-trading hours frequency) :
4 periods accumulated return (16 hours) : 0.6%
percentile : 59%
9 periods Return (36 hours) :0.6%
percentile : 49%
Volatility :
10 period Volatility (40 hours) : 6.1% annualized
percentile : 13%
Relative Volatility (10 per / 50 per)
percentile : 60%
Markov Regime Switching identifier ( daily close ) :
Probability of a strong uptrend regime : 0
Probability of a weak uptrend regime : 24.6
Probability of a sideways / weak uptrend regime : 52.1
Probability of a downtrend / volatile regime : 22.6
SPY - VIX statistical relationship ( daily close ) :
zone : uptrend
percentile : 67% [ normal ]
Wavelet Discontinuity Watch (daily close ) :
Risk of a correction / crash increasing.
High volatility regime pattern emerging.
Overall commentary for Jan/14/2011:
NeuralTrend model up with high confidence for third consecutive day.
Filtering model main trend is up, with increasing momentum. Both models are capturing the relentless grind up of the equity market.
Volatility started to increase again.
MatLab´s Markov model WARNING signal posted yesterday is still valid as the downtrend regime probability closed at 22.6%.
Wavelet model probability of a discontinuity is increasing, and showing similarities with April 2010 highs.
Wavelet WARNING signal was posted, usually lead to a short term stronger move, at a minimum. Signal may need some time to play out, like between 1 or 3 days. It is not configured as a crash/strong correction pattern still.
Model suggested positioning still did not change : small short with stops at SPY highs around 127.8.
Model does not recommend full position shorting until signals are flashing.
Good trading.
Lacking enough Flying-Hours in Quantitative Thinking ? Then try Understanding Daily Reports first.