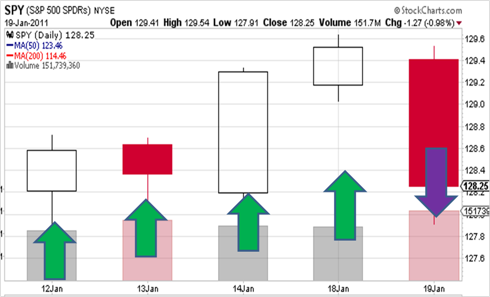
chart [ green arrow : uptrend high confidence | yellow arrow: uptrend low confidence ]
chart [ red arrow : downtrend high confidence | purple arrow : downtrend low confidence ]
Statistical Learning Models :
Neural Net Daily Trend Identifier : DOWN [0.67 confidence : Low ]
Daily Short-Term Overreaction : UP [confidence : High]
Filtering Model (4-hour frequency):
Main Trend : UP
Momentum : UP [decreasing]
Mean Reversion (4-trading hours frequency) :
4 periods accumulated return (16 hours) : <0.36%>
percentile : 30%
9 periods Return (36 hours) : 0.6%
percentile : 49.5%
Volatility :
10 period Volatility (40 hours) : 6.5% annualized
percentile : 17%
Relative Volatility (10 per / 50 per)
percentile : 72 %
Markov Regime Switching identifier ( daily close ) :
Probability of a strong uptrend regime : 0
Probability of a weak uptrend regime : 2.4
Probability of a sideways / weak uptrend regime : 49.2
Probability of a downtrend / volatile regime : 48.4
SPY - VIX statistical relationship ( daily close ) :
zone : uptrend
percentile : 68% [ HIGH ]
Wavelet Discontinuity Watch (daily close ) :
Risk of a correction / crash increasing.
High volatility regime pattern emerging.
Wavelet Discontinuity Watch (4-hour frequency close ) :
Volatility signal was generated on 01/19/2011.
Overall commentary for Jan/20/2011:

Market down today generated a lot of warnings all over our quantitative models.
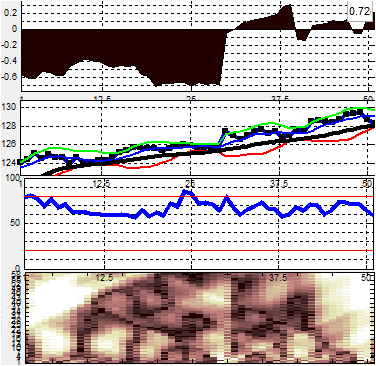
Just above you see in first plot, relative volatility of SPY (4-hours frequency) and it´s percentile. Rising volatility is a required ( but not sufficient ) condition for trend change, and that is met now.
On the second plot you see the SPY closing prices. It´s sitting on it´s 20 period moving average (4-hours) We need the moving average to turn down before a confirming trend change.
The third plot is RSI, already pointing down.
The fourth plot is the intraday (4-hours) wavelet multiresolution plot. The picture is not pretty for bulls, at least in short-term. The white pattern shows that the current trend is at risk, and higher short term volatility is likely.
It cannot tell you the market direction, but mix that with other indicators and you can tell volatility to downside is much more likely than the contrary.
Next, the markov model "downtrend / volatile regime" probability (plot not shown), climbed to 48.4. In previous cycles, such a spike was reversed as market rebounded, but then would resume IF the short-term trend really changed. That happened in all bear moves of 2010. Either way, more downside to equities is very probable according to this model.
Finally wavelet daily close model is showing increasing signs of a bigger correction.
Good Trading.
Lacking enough Flying-Hours in Quantitative Thinking ? Then try Understanding Daily Reports first.