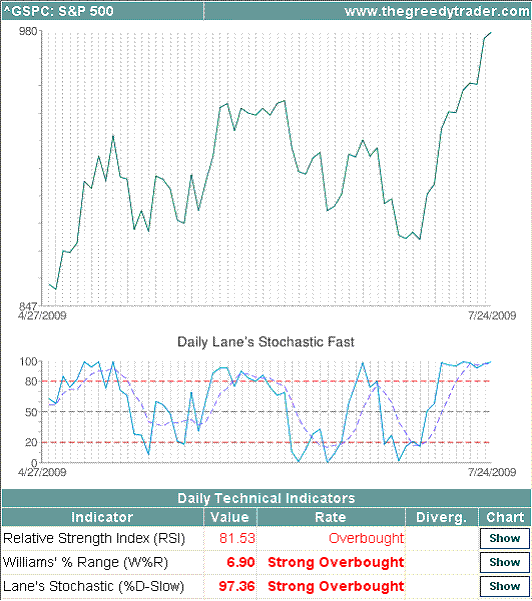
The Standard & Poor's 500 Index gained more than 12.7% since July 8th, and almost 47% since March 6th, reaching 979.8 on Friday, the highest level since November 5th, 2008. Daily Lane's Stochastic, Williams' % Range and Relative Strength Index are overbought/strongly overbought for all three major US indices. Weekly Williams' % Range is strongly overbought, signaling that market is moving too fast in a weekly time frame as well; and the rally may not be sustainable for a long period. 109 out of S&P 500 members are overbought, 51 stocks have daily MACD bearish divergence, indicating that the rally is already slowing down. The next resistance level for S&P 500 index is around 993. Considering overbought technical indicators, it would be difficult to break this resistance level; and chances are high that the stock market trend may reverse soon.