| Major US indices |
| All three major US indices were negative and had prices below 20 and 50 Day Moving Average. Monthly Lane's Stochastic is overbought. |
| Dow Jones Industrial Average |
During the past week, Dow Jones Industrial Average (^DJI) sank 507.65 points or 2.87%, to 17164.95.
The Dow Jones Industrial Average quarterly uptrend started on November 16, 2012 at 12,471.49 and reached 18,103.45 on December 26, 2014, making a 45.16% gain in seventy-six weeks. |
| ^DJI: Dow Jones Industrial Average quarterly trend | 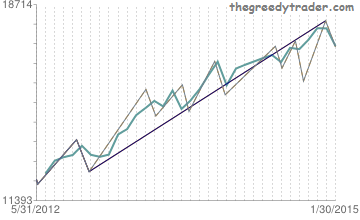 | |
| Williams' Percentage Range and Lane's Stochastic are overbought in a monthly time frame. The Dow Jones price is near 200 Day Moving Average. The 200 Day Moving Average is often acts as a support or resistance level. |
| S&P 500 Index |
| The S&P 500 Index (^GSPC) sank 56.83 points to 1994.99 during the week. The S&P 500 quarterly uptrend started on November 16, 2012 at 1,343.35 and reached 2,093.55 on December 29, 2014, making 55.85% increase in seventy-six weeks. |
| ^GSPC: S&P 500 quarterly trend | 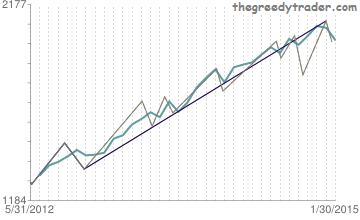 | |
| The S&P 500 monthly downtrend started on December 29, 2014 at 2,093.55 and reached 1,988.12 on January 16, 2015, making 5.04% loss in two weeks. |
| ^GSPC: S&P 500 monthly trend | 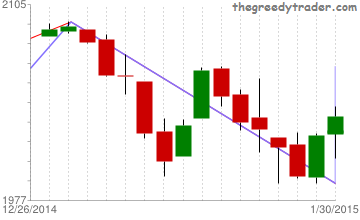 | |
| The S&P price is near 100 Day Moving Average. Williams' Percentage Range and Lane's Stochastic is overbought in a monthly time frame. |
| NASDAQ Composite Index |
| The NASDAQ Composite Index (^IXIC) ended down 122.64 points or 2.58%. The NASDAQ Composite Index quarterly uptrend started on April 15, 2014 at 3,946.03 and reached 4,814.95 on December 26, 2014, making 22.02% increase in twenty-five weeks. |
| ^IXIC: NASDAQ Composite Index quarterly trend | 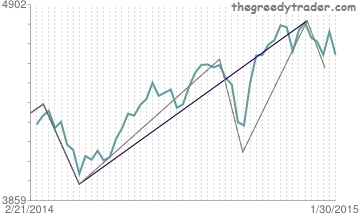 | |
| The NASDAQ Composite Index monthly downtrend started on December 26, 2014 at 4,814.95 and reached 4,563.11 on January 16, 2015, making 5.23% drop in two weeks. |
| The monthly Williams' Percentage Range (W%R) is strongly overbought and monthly Lane's Stochastic (%D-Slow) is overbought. Daily RSI has formed a Bullish Failure Swing. A bullish Failure Swing is a strong indication of an uptrend reversal. The daily Lane's Stochastic main line (K%) crossed below an overbought signal line (D%). The Stochastic crossover in overbought area is a sell signal. NASDAQ price is near 100 Day Moving Average. |
| S&P 500 Members Alerts |
| Almost 54% of S&P 500 component stocks have price crossed below Parabolic SAR signal. It is a highest level since April 11, 2014. |