Introduction
Halliburton (HAL) remains a compelling investment opportunity for those who are looking for higher yields in the energy sector of the economy. The company continues to invest aggressively in order to remain competitive with its peers, and is likely to generate reasonable yields for investors in the foreseeable future.
Qualitative Analysis
Source: Information pertaining to HAL came from the shareholder annual report, shareholder quarterly report, Energy Information Administration, along with YCharts.
Halliburton continues to expand its operations and is primarily focused on developing solutions for upstream producers of crude oil. It is estimated that the average recovery factor for crude oil from fully developed wells is 35%, for 70% of the world's oil fields. This means that developing solutions for these types of oil fields, where oil recovery is difficult, will improve the global supply of crude oil. Halliburton aims to offer solutions and innovative technologies for upstream producers of crude oil, so they can derive higher efficiency from their oil fields.
Halliburton has increased its capital expenditures above the statistical 4-year mean, implying that the company is ramping up its ability to produce oil rigs.
The days in inventory outstanding (number of days inventory remains on the balance sheet before sold) is above its statistical 4-year mean. The company generally increases the amount of inventory it has prior to periods of rapid net income growth. I am willing to assume that the company is stockpiling inventory in anticipation of future demand based on historical data. Furthermore, I back this assumption due to the projected increases in production, which is based on the chart below.
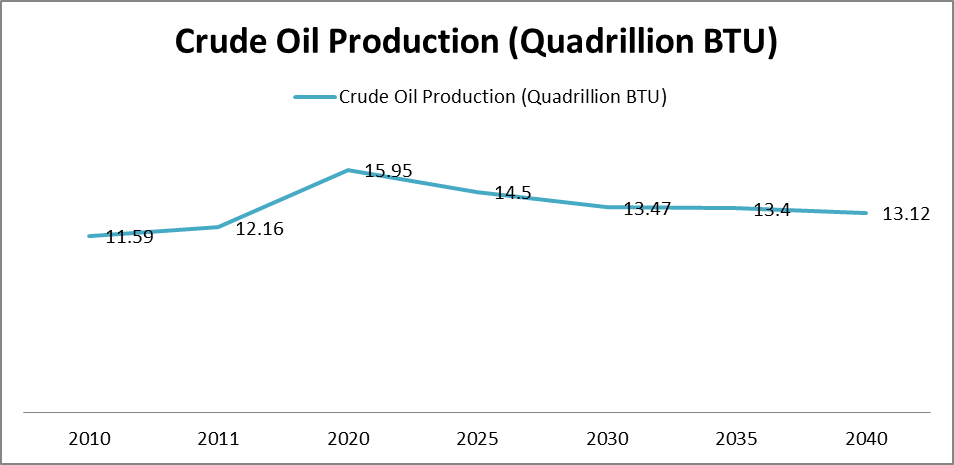
Source: Data from U.S. Energy Information Administration
Crude oil production is projected to increase to approximately 15.95 quadrillion BTU by the year of 2020. The crude oil production is projected to decline by 2025. But depending upon the type of hydraulic fracturing techniques developed, peak oil may happen at a later point, perhaps 2030. This means that Halliburton's business remains secure and unaffected by externalities in the foreseeable 5 year investment time frame I have for investors in my articles. Even if oil production were to decline, Halliburton is further downstream and has less risk exposure to declining crude oil production and may in fact benefit from declining production by offering services and solutions to further maximize the yields from pre-existing oil fields.
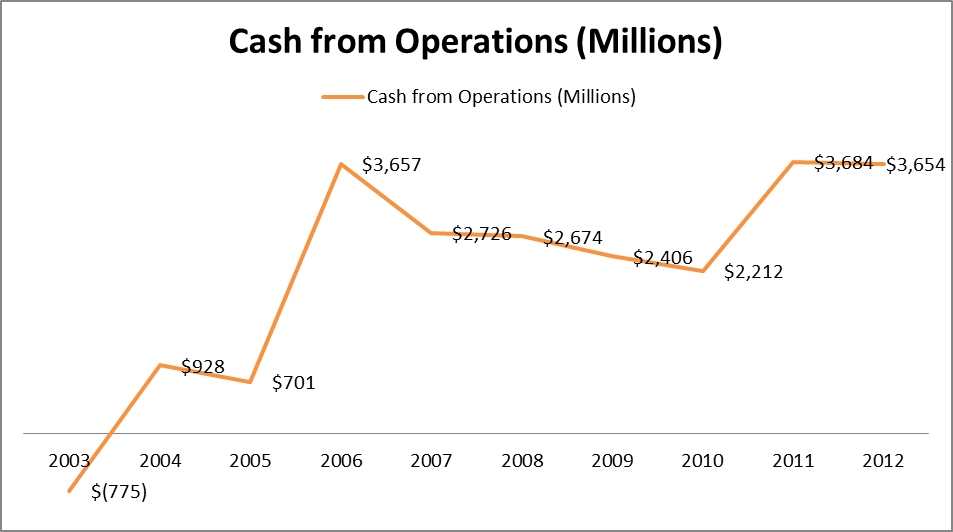
Cash from operations has improved drastically over the past 10 years. Cash flows are likely to improve as the company's inventory levels are likely to decline based on historical data. The cash from operations declined between 2006 and 2010 due to the cyclical nature of oil production. The price of oil can have an effect on the demand for oil rigs.
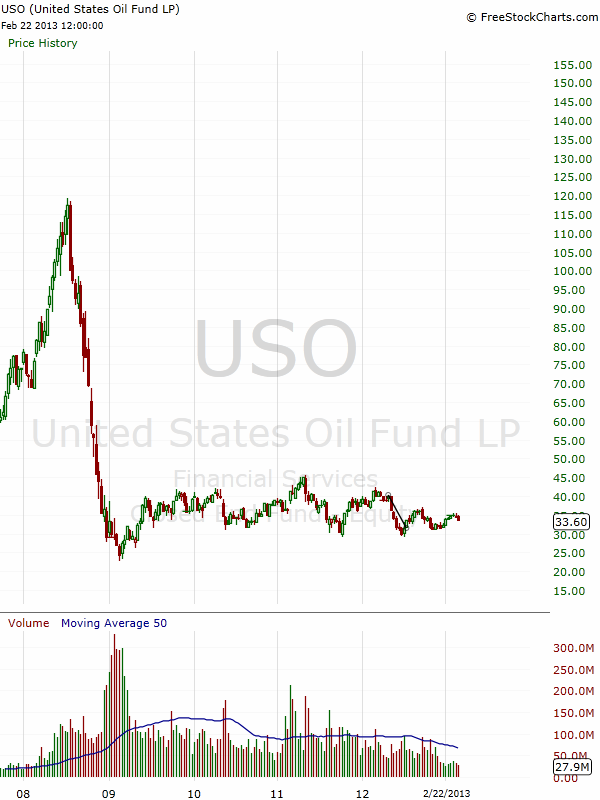
Source: Chart from freestockcharts.com
The demand for oil rigs declined even before the price of crude oil fullypeaked, meaning that rising prices decreases the demand for oil rigs. This is because consumers consume less crude oil when the price of oil goes up, and as a result production of oil decreases. During the 2008-2009 period, speculation on crude oil futures kept prices of crude oil at artificially high levels. I don't anticipate this type of behavior over the next 5 years, and I believe that what happened during 2008 and 2009 was a statistical anomaly. I have a stable outlook on the price of crude oil, meaning that I anticipate the price of crude oil to rise at a rate higher than inflation; but I don't anticipate a sudden jump in the price of crude similar in magnitude to 2008 and 2009.
Technical Analysis
Halliburton' stock price has been extremely volatile over the past decade. The company is exposed to the price of energy and it can be generally assumed that sudden rises in the price of energy can have a drastically negative effect on the demand for oil rigs. Despite this fact, I believe that since production is likely to increase in the foreseeable future, it is likely that the stock will trade at new all-time highs by 2015 to 2016.
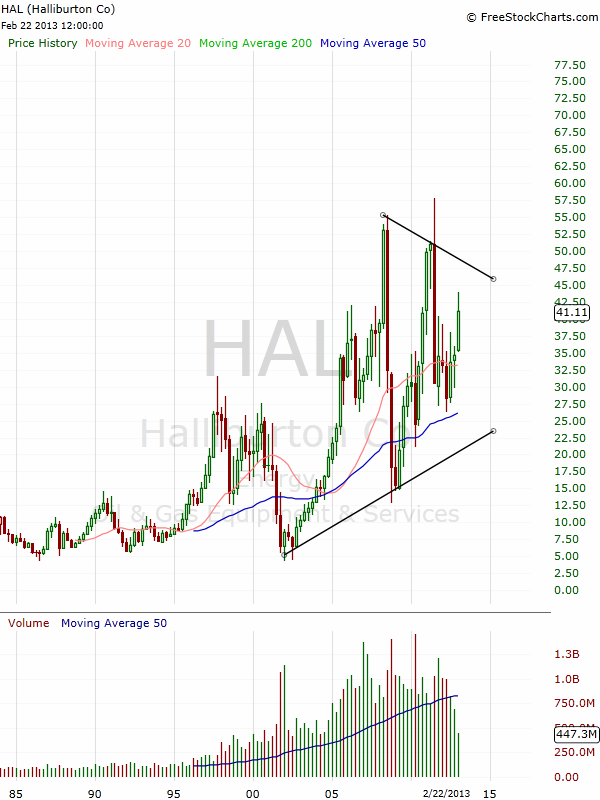
Source: Chart from freestockcharts.com
The stock is trading above the 20-, 50-, and 200- Day Moving Averages. The stock will continue to appreciate over the long term, and is in the beginning stages of a multi-year up-trend.
Notable support is $30.20, $36.00, and $39.30 per share. Notable resistance is $51.00, $55.00, and $60.50 per share.
Street Assessment
Analysts on a consensus basis have reasonable expectations for the company going forward.
Growth Est | HAL | Industry | Sector | S&P 500 |
Current Qtr. | -34.80% | 6.40% | N/A | 11.40% |
Next Qtr. | -12.50% | 29.10% | N/A | 17.80% |
This Year | 1.00% | 5.50% | 1.80% | 9.50% |
Next Year | 31.10% | 13.50% | 3.20% | 12.70% |
Past 5 Years (per annum) | 8.49% | N/A | N/A | N/A |
Next 5 Years (per annum) | 14.54% | 13.78% | 13.44% | 8.82% |
Price/Earnings (avg. for comparison categories) | 13.78 | 21.23 | 21.13 | 15.65 |
PEG Ratio (avg. for comparison categories) | 0.95 | 2.41 | 2.09 | 2.06 |
Source: Table and data from Yahoo Finance
Analysts have high expectations, as analysts on a consensus basis have a 5-year average growth rate forecast of 15% for earnings (based on the above table). This growth rate is above the industry average for next 5-years (13.78%).
Earnings History | 12-Mar | 12-Jun | 12-Sep | 12-Dec |
EPS Est | 0.85 | 0.75 | 0.67 | 0.61 |
EPS Actual | 0.89 | 0.8 | 0.67 | 0.63 |
Difference | 0.04 | 0.05 | 0 | 0.02 |
Surprise % | 4.70% | 6.70% | 0.00% | 3.30% |
Source: Table and data from Yahoo Finance
The average surprise percentage is 3.6% above analyst forecast earnings over the past four quarters (based on the above table).
Forecast and History
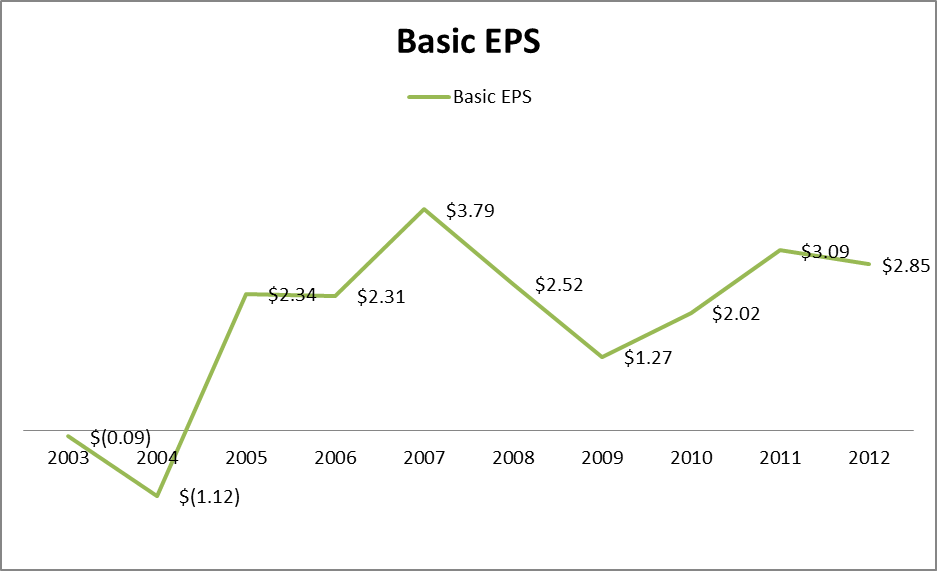
Year | Basic EPS | P/E Multiple |
2003 | $ (0.09) | - |
2004 | $ (1.12) | - |
2005 | $ 2.34 | 12.25 |
2006 | $ 2.31 | 12.55 |
2007 | $ 3.79 | 9.43 |
2008 | $ 2.52 | 6.88 |
2009 | $ 1.27 | 22.96 |
2010 | $ 2.02 | 19.82 |
2011 | $ 3.09 | 11.05 |
2012 | $ 2.85 | 12.17 |
Source: Data from YCharts
In 2003 and 2004 the company reported a loss due to losses from discontinued operations which resulted in impairment, the losses did not negatively affect the cash flow for the period. The EPS figure shows that throughout the 2003- 2006 period, the company was able to grow earnings. Throughout 2007 to 2009 earnings contracted. The contraction in earnings was due to the great recession. Following the recession the company was able to grow earnings.
Source: Data from YCharts
By observing the chart we can conclude that the business is somewhat cyclical and is affected by macroeconomics. Therefore one of the largest risk factors to HAL is the slowing of international gross domestic product growth. So as long as the global economy continues to grow, the company will generate reasonable returns over a 5-year time span based on the forecast below.

By 2018 I anticipate the company to generate $6.89 in earnings per share. This is because of production growth, improving global outlook, earnings management and continued development overseas.
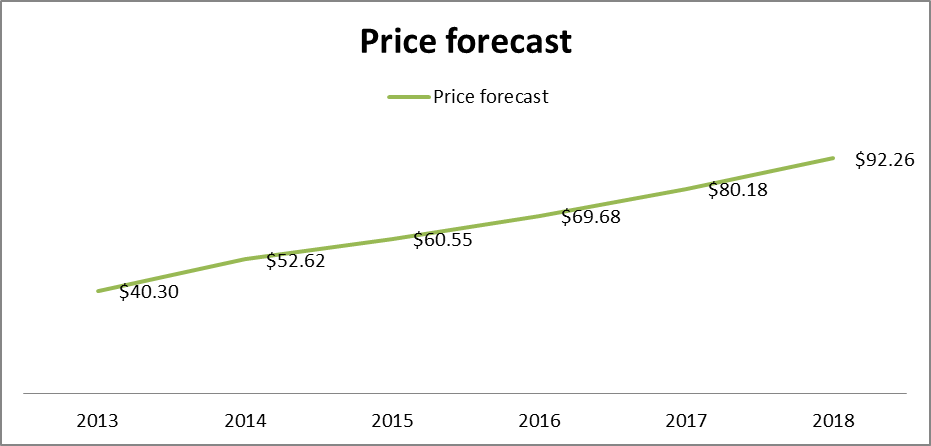
The forecast is proprietary, and below is a non-linear chart indicating the price of the stock over the next 5-years.
Below is a price chart incorporating the past 10 years and the next 6 years. Detailing 16 years in pricing based on my forecast and price history on December 31st of each year.
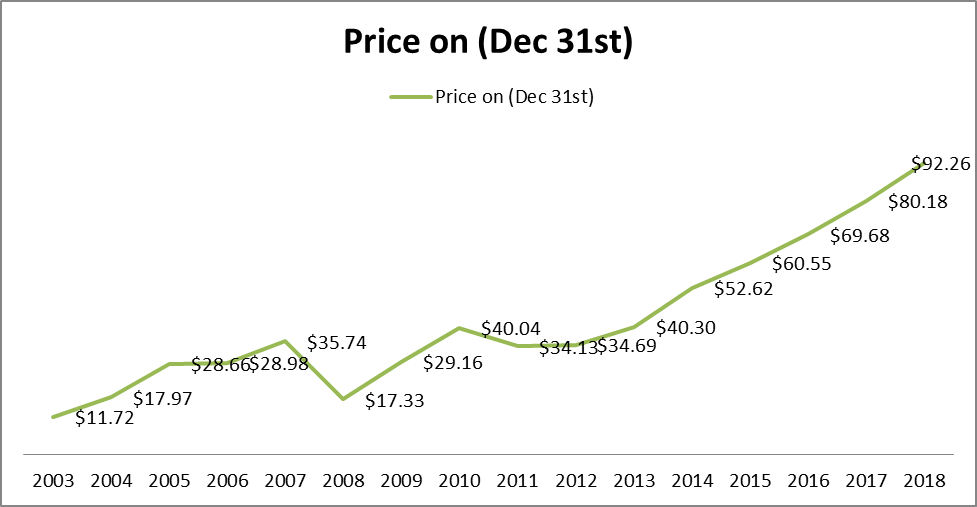
Source: Data from YCharts and price history is from Yahoo Finance.
Investment Strategy
HAL currently trades at $41.11. I have a price forecast of $40.30 for December 31st 2013. The stock is currently trading at a fair valuation, but should be bought on pull backs as a part of a longer-term accumulation strategy.
Long Term
The company is an exceptional investment for the long term. I anticipate HAL to deliver upon the price and earnings forecast despite the risk factors (competition, regulation, economic environment). HAL's primary upside catalyst is international expansion, production growth, share buybacks, and managing costs. I anticipate the company to deliver upon my forecasted price target of $92.26 by 2018. This implies a return of 140% (including dividends) by 2018. This is a great return for an oil well services stock.
Year | Dividend Yield @ $41.11 per share | Cumulative Total |
2013 | 1.72 | 1.72 |
2014 | 1.98 | 3.70 |
2015 | 2.28 | 5.98 |
2016 | 2.62 | 8.60 |
2017 | 3.01 | 11.61 |
2018 | 3.46 | 15.07 |
A higher yielding investment opportunity albeit having higher risk is to buy the Jan 17, 2015 calls at the $42.00 strike. The call premiums trade at $5.35. The price forecast for the end of 2014 is $52.62. The rate of return if the calls expire at $52.62 is 98.50%, the option will break-even when the stock trades at $47.35.
The risk-to-reward on the option investment is decent. The risk however is somewhat high (1.6 beta).
HAL has a market capitalization of $38.3 billion; the added liquidity makes this an investment opportunity appropriate for larger institutions that require added liquidity.
Conclusion
Oil wells may run dry, but oil rigs won't be hit with a dry spell for quite a while. The future remains bright for Halliburton. Therefore the conclusion remains simple: buy HAL.
Disclosure: I have no positions in any stocks mentioned, and no plans to initiate any positions within the next 72 hours. I wrote this article myself, and it expresses my own opinions. I am not receiving compensation for it. I have no business relationship with any company whose stock is mentioned in this article.