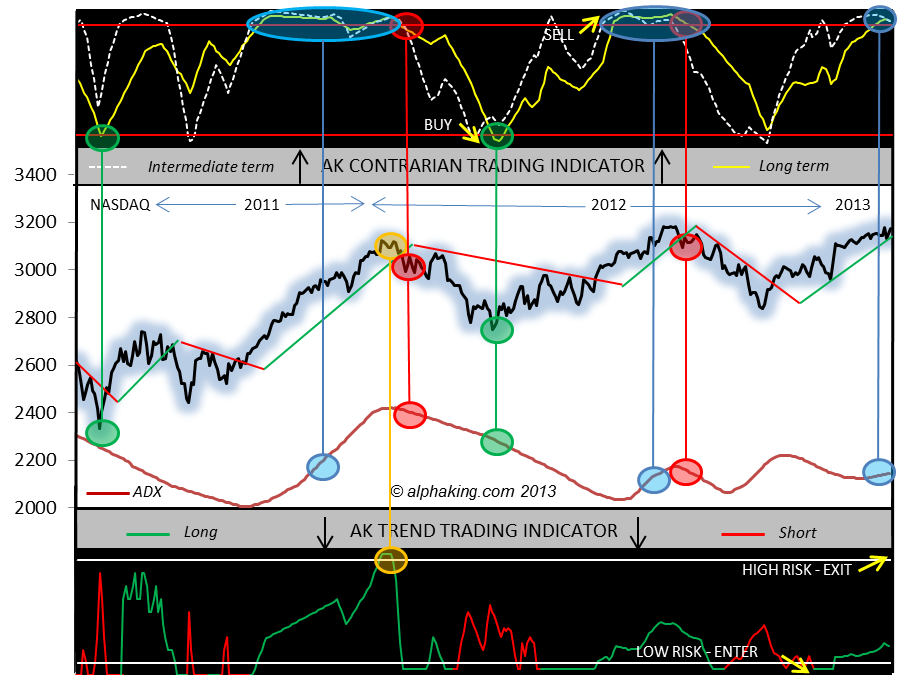
When in a high risk - blow-off bull - phase of the bull/bear cycle, which we are currently in, the interplay of the yellow long term contrarian oscillator line and the maroon ADX line in the chart below is critically important, especially when the long term contrarian oscillator reaches an oversold or overbought extreme, as it currently is.
The blue circles highlight how the stock market can remain in an extremely overbought condition when the ADX is rising, while the red circles highlight what happens once the ADX starts to turn down - with a move from extreme overbought to extreme oversold landing shortly there-after once the ADX line starts to turn down.
When in high risk - blow-off bull - phases I time trades using the contrarian indicator (top of chart) when the ADX line is falling, while I time trades using the Trend Trading Indicator (bottom of chart) when the ADX line is rising, as it currently is. The orange circle shows the optimal time to exit long trades using the Trend Trading indicator when the ADX line is rising.
Currently, the Trend Trading Indicator shows lots of room for further stock market rally, and I will hold my long positions while that remains the case and the trend remains up. The NASDAQ is trying hard to breach above its mid-September high at 3184, and things get super-bullish if that happens. We closed at 3171.6 yesterday.
Things go pear shaped and bear shaped on a failure of the NASDAQ to join the breakout club, though the volume over the past couple of days was constructive to the bull case, with heavier volume on yesterday's rally over what we saw on Monday's plunge.
I remain long QLD, and looking at a rebound in Apple to add some much needed leadership to the currently lagging Qs.
Kevin Wilde, Chief Trading Strategist, Alphaking.com
Disclosure: I am long QLD.