Now Feb is out of the way I thought I'd see how the current stock market movement compares to past cycles.
I divide the stock market into four distinct phases based on risk (for the bulls) - low, moderate, high, extreme - with 2013 in the High Risk variety.
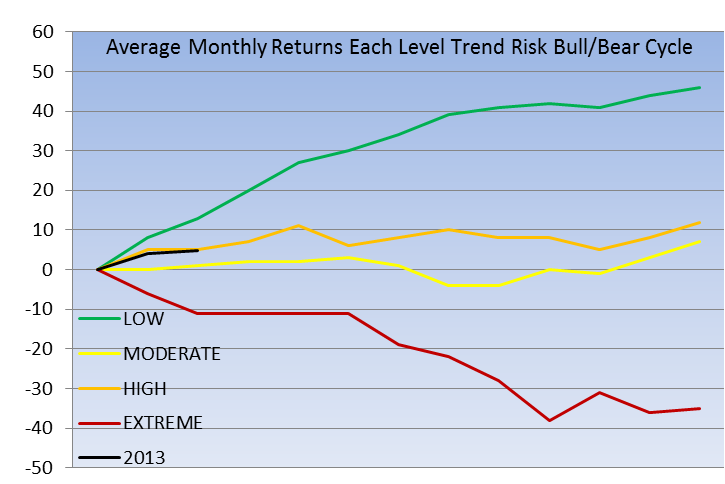
The chart below shows average monthly returns for each of the four phases, with orange (high risk) the expected path this year should take (black line = 2013)
As you can see, current NASDAQ performance is exactly what was expected for the first two months of this year. If the pattern holds we are facing an acceleration of the rally to end the first quarter, with a rally peak expected to land in April or early May.
Unlike the other three phases of the bull/bear cycle, high risk years can be very short - sometimes lasting only a month or so, sometimes a year or more - and the blow-off is over the first time the bears secure a big victory on any of the corrective attempts, something they failed to do the whole of last year.
High risk years ALWAYS are followed by a MAJOR bear market along the lines of the red/maroon of the extreme risk phase.
While the orange line may not look too scary to the bulls, remember the red/maroon extreme line can start at any moment.
While high risk environments are the trickiest to trade, absent that big bear win the motto is enjoy making hay while the financial sun is shining. 1929, 1972/3, 1987, 1999/2000, 2007 are notable high risk phases, and only occur ahead of the worst bear markets and financial crises in history.
In short: top not in yet, could party like its 1999, though once top is in and bears score that big win, watch out below....
Kevin
Disclosure: I have no positions in any stocks mentioned, and no plans to initiate any positions within the next 72 hours.