The Alpha King Trend indicator remains in buy mode, confirmed with the accumulation/distribution profile, with volume picking up on the recent breakout.
The leadership profile remains very positive, with 870 new highs versus 35 new lows.
Trends: semis +, transports +, small caps +, energy +, China +, gold -, UK +, financials +, copper +, high yield +, munis +, US bonds +, emerging markets +, Yen carry trade -
The trend momentum power rating remains a reasonably strong 60% bull.
If you would like to track updates on the charts shown below sign up at alphaking.com, click on the verification email, and get THREE months access to my on-line newsletter for free! This is a limited time offer that will not be repeated in 2013.
The 4% rule remains positive, while Federal Reserve policy remains very accommodative. The McClellan Summation index is acting better, though remains below the 500 level, which is a level that confirms the rally is for real, and we still await that confirmation. The VIX volatility indicator closed the week at 13.3, showing a pullback in fear. The Elliott Wave count once again has turned bullish, and now is in a fifth wave blow-off that likely ends the bull market off the 2009 lows once the rally exhausts itself, similar to what happened in late 1999, early 2000…
Summary:
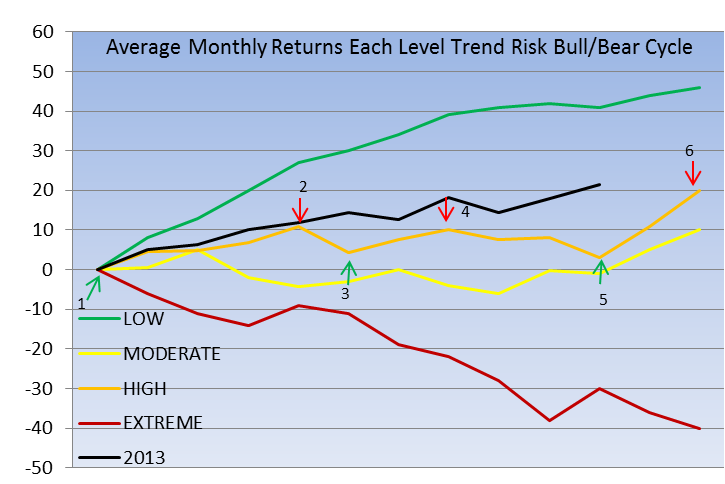
The AK strategy in high risk blow off phases - like we are in - calls to follow the trend in the first and fourth quarters of the year, while trading contrarian extremes against the trend when the ADX line is trending down in the second and third quarters.
The orange line in the first chart below is the expected monthly returns when in high risk blow off phases, with the black line what the S&P500 actually did this year. Unfortunately the pullbacks from #2 thru #3 and #4 thru #5 were so short lived that we were not rewarded in the expected second and third quarter churn, with the drama in Washington also having us move to trading with the trend to start the fourth quarter a tad later than optimal.
Still, over the long term I fully expect to come out a winner during such churn periods, and I will stay with the plan in 2014, which, if the rally does indeed continue into next year as expected, will also be a high risk blow off phase, thus the chart below will come into play again.
High risk years repeat till the bears score that big win on one of the corrective attempts, and then the maroon extreme risk - new MAJOR bear market - line is the one to track.
Update continues below chart...
The second chart shows the close up view of the S&P500, with the updated bullish wave count added. Note the weekly ADX line has now turned up, and the top contrarian indicators do not work well when a rising ADX confirms the rally has strong momentum. The ADX for the NASDAQ has also turned up. So too the Russell 2000 and S&P400 ADX. The indicator to follow to enter and exit positions when the ADX is rising is the trend trading indicator at the bottom of the chart.
Update continues below chart...

The third chart shows every index and indicator confirming the rally, except UK stocks and volume, with those latter two likely to join the confirmation fun early next week. While such blow offs always end badly, they can run a long time, with the final peak remaining MIA till significant divergences develop. While we've had tons of such divergences throughout this year, those are disappearing fast.
Update continues below chart...

The final chart is a big picture view of where I believe we are, as the Dow Industrials takes another shot at the upper trend-line of a massive expanding triangle. The exact level at point E is 16,500 by year-end, 17,000+ by mid-2014, and 18,000 by year-end 2014 (as the line is rising.) The red dotted line is what usually happens when expanding triangles complete, and while that fits the bull/bear cycle - which calls for a MAJOR bear market once the blow off phase completes - the depth of that bear does not have been quite as severe as the triangle analysis suggests. Though it wouldn't surprise me if it was. But let's get through this mega volatility one trade at a time, and for now that means "all aboard the blow off party," and long may that phase last!

Have a great weekend!
Kevin
If you would like to track updates on those charts you can take a three month free trial to my alphaking newsletter. Simply sign up for the 30 day trial at alphaking.com, click on the verification email, and we will adjust to three months. I run four tracking portfolios - so lots of stocks to buy and sell! - as well as a 401K advisory for those looking to make and protect money in their retirement nest-egg.
Disclosure: I am long MDY.