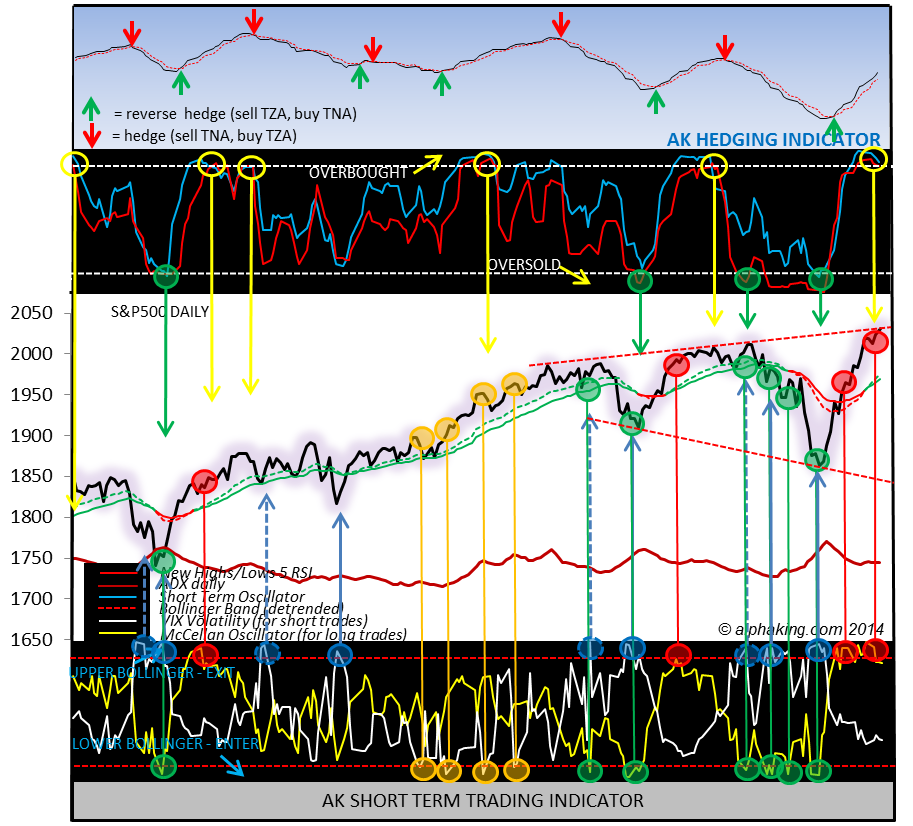
The first chart below shows the short term indicators on a new sell, while the S&P500 closed EXACTLY at resistance of the upper trend line of an expanding triangle today. That should mark the end of the rally, with an expected drop to test the lower trend line of the expanding triangle - way down there - likely on deck next.
With all the talk about seasonals, and with the 1929 pattern highlighting the last week of November as the crash week, the bulls appear to be on the cusp of having their investment world turned upside down in what the history books will likely label the Thanksgiving crash.
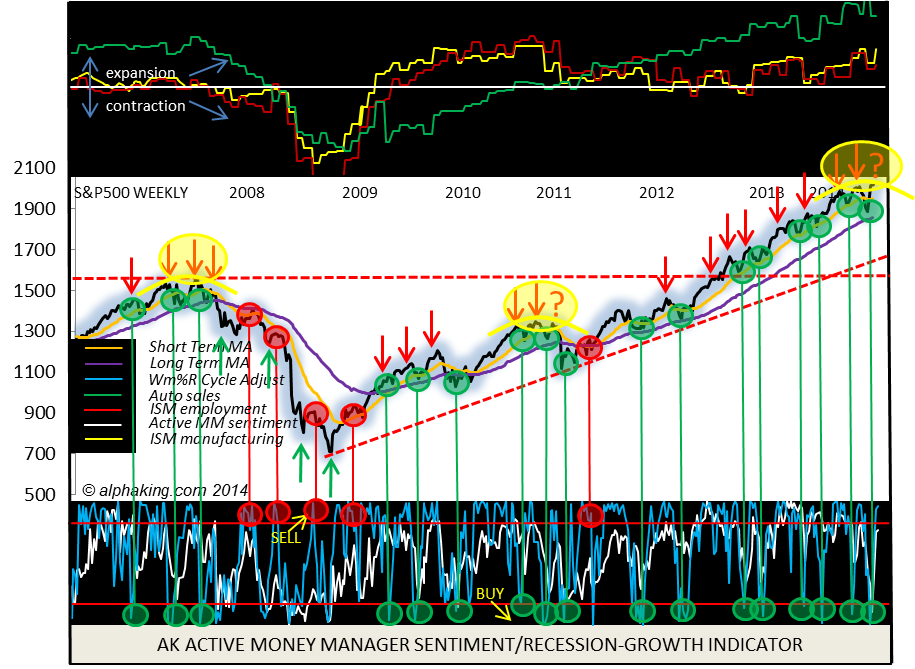
The next chart shows the S&P500 remaining on a green circle buy after bouncing off a test of the slower moving trend average (purple line,) though struggling at resistance of a triple top similar to what happened in 2007 pre bear market, and 2011 pre-crash.
Note the red lines of the prior breakout and major uptrend line are in place to suck prices into those support areas once the crash gates open.
The difference between the third red arrow and the question marks is in 2007 investor sentiment crossed above the overly bullish extreme line, while in 2011 - and currently - investor sentiment failed to make it all the way back to fully invested before the third and final rally of the topping process exhausted itself.
The VIX cycle turned negative yesterday, and is slated to remain negative till December 24, so we are not only having bear for Thanksgiving, the stock market bottom is not expected to land till Christmas - which, of course, is very similar to the 1929 comparison projection.
A gap down open tomorrow post jobs report, on the backs of weak action in Europe now the ECB have once again proven to be all talk and no action re QE, that takes out the uptrend line off the October 16 lows shown in the 1929 comparison chart, would be the perfect start to the bear slide ahead of us, and exactly my expectation.
If you would like to track updates on the chart shown below sign up at alphaking.com, click on the verification email, and get THREE months free access to my on-line newsletter.

-Kevin