“Don’t try and bend the spoon. That’s impossible. Instead… only try to realize the truth. There is no Spoon.” – Spoon Boy, The Matrix
Last Monday’s ‘Jo’ focused on the “look-of & psychology-behind” the first leg of new Cyclical Bear Markets (1st selloff and subsequent consolidation). With last week’s action – 8% drop in the broader U.S. Markets and retest of the August 8th yearly low (1,120) – many have inquired if now is the time to get out or is it too late? As investors search for this answer, they tend to find themselves paying much more attention to the current headlines hoping for an inkling of something to hang their proverbial hat on. This can not only seem daunting, but even confusing considering the massive amount of conflicting opinions. Today’s ‘Jo’ attempts to provide insight into the search for this answer.
In reading forward, the interpretation is geared toward understanding the most probable technical levels next in line; up or down. In turn, allowing the investor themselves to determine, given their particular risk tolerance, whether or not they should take their chips off the table.
Cyclical bear markets are structurally altered from their counter parts – cyclical bulls – for various reasons. First, as you’ve read in some of our past missives, “Bull Markets take the stairs and Bear Markets take the Elevator.” Hence, when assessing the time involved with subsequent drops, it’s considerably less (half to a third). Second, which goes hand in hand, the volatility (range of action given a particular scale of time) is much greater. These differences become very evident when looking at the 18% drawdown in the last 4 months (May 2011 to August 2011) which took 8 months to create (October 2010 to May 2011) and the 8-9% weekly swings of late. From a psychological perspective one could say Bull Markets are much more rational than Bear Markets. Fear is a powerful emotion.
Knowing this, there are also similarities in which longer-term support and resistance points coincide. These areas (which we coin as Floors & Ceilings) are points in which there is increased probability of consolidation before continuing on their current path or entirely changing direction. To gain a better understanding of this we’ve included a 15-year monthly chart of the SPX in which we’ve outlined these areas.
SPX Monthly

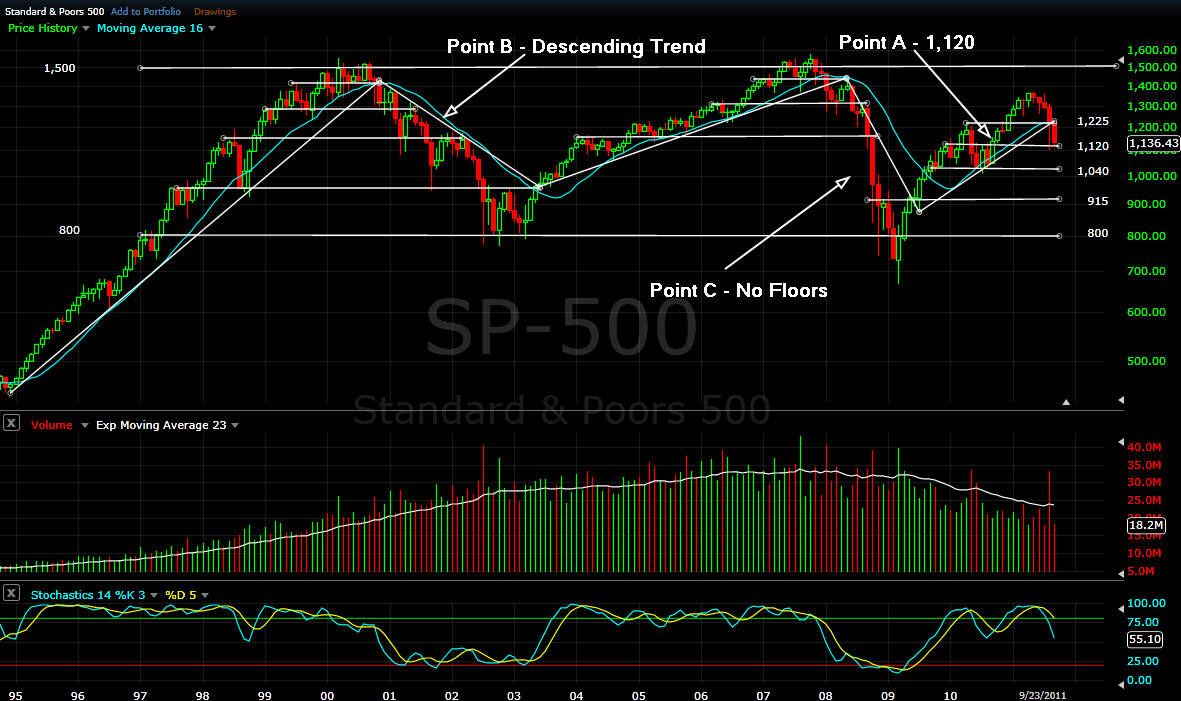
The area between 800 and 1,500 represents TAM’s 100 – Year Market Theory’s Secular Channel. Without getting too detailed and discussing Cyclical Topping or Bottoming Consolidation Periods, in the 2000 - 2011 Secular Channel there are essentially 3 Cyclical Bull Market Periods and 2… wait… now 3 Cyclical Bear Market Periods. All of which are unique but hold the same aforementioned characteristics. This also holds true for all the cyclical bull and bear markets within the other three secular channels of the last century – see our theory for further illustration.
As mentioned, when a bear market begins there is a tendency for disbelief, hence the buyers at specific points along the way down. These buyers show up at the same level where the market last moved ahead of a resistance point in the previous bull move. Why? Because the investors which saw a value at those levels have not changed their mind and see an opportunity to buy at values not seen since that time. On an ancillary note, the value they see equally corresponds to the fact that in the beginning of a bear market most Wall Street Analysts have not revised their earnings estimates down as of yet. The most recent case (Point A) was, remarkably enough, on September 24th 2010 – exactly one year ago at 1,120. This buying begins the 1st consolidation period. From this point the market’s range is the original break and the buying point (Floors & Ceilings). Now it’s a fight to the finish – will the sellers takeover the buyers and break the bottom side of the new consolidation? (1,120)
As this process continues (continually breaking into new lows and retesting the previous breaks), one can ascertain the next probable location where value (for some) will once again appear and buyers return. This process will continue until all the exuberance and valuations have completely waned. All of the aforementioned levels (Floors & Ceilings) correspond not only to valuations but to investor psychology. This is best depicted by Jeffrey Saut’s (of Raymond James) Fear, Hope & Greed Chart, most recently published on September 12th.
During this process the market will begin to form a definitive descending line across all the tops from which the next consolidation floor bounces to a ceiling but cannot overtake (Point B – Descending Trend). This becomes the line in the sand to determine a potential change back to a bull phase. Conversely, in some cases there is no floor and attempting to find buy points can become moot – here in lies the unknown. (Point C)
Now, back to the original question… “Is it too late to sell?” You tell us?
We truly hope this helped!
TAM-KAT