I'm not going long on this basis along and need more confirmation, but note the inverse head & shoulders pattern in the S&P 500. The SPX currently also sits right at the 50 day moving average (yellow line) and this morning is gapping up 0.7%. I need more confirmation to go long, but for now this is an interesting discovery. An ultimate final target of this inverse head & shoulders pattern would also be around $1340, which is the high-end of the $1380 - $1340 final upside target I currently see for the SPX. Funny how these things work huh?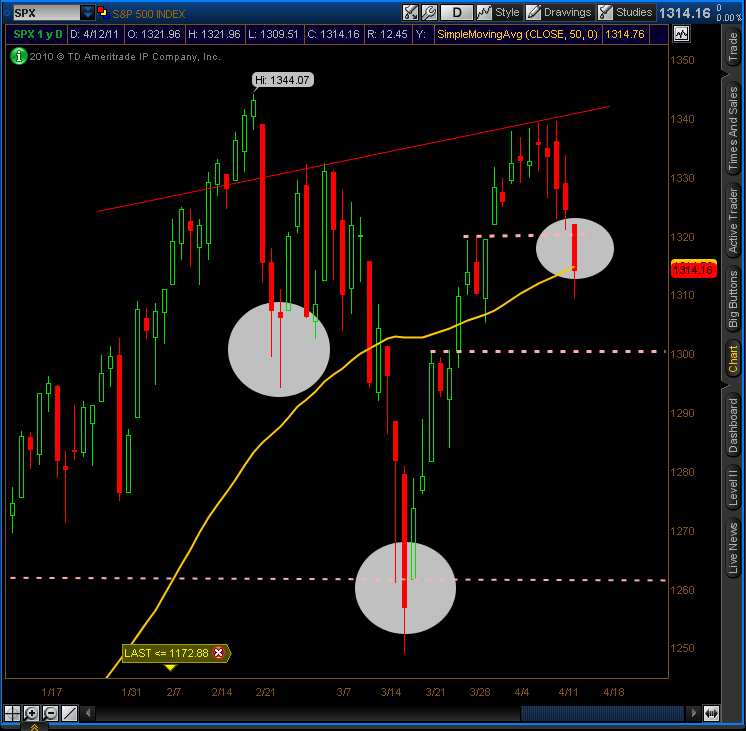
S&P 500 Inverse Head & Shoulders Pattern?
Seeking Alpha's Disclosure: Past performance is no guarantee of future results. No recommendation or advice is being given as to whether any investment is suitable for a particular investor. Any views or opinions expressed above may not reflect those of Seeking Alpha as a whole. Seeking Alpha is not a licensed securities dealer, broker or US investment adviser or investment bank. Our analysts are third party authors that include both professional investors and individual investors who may not be licensed or certified by any institute or regulatory body.