Lets take a look at the broader view of the most recent high and low in the E-Mini S&P futures contract, and the $SPX index.
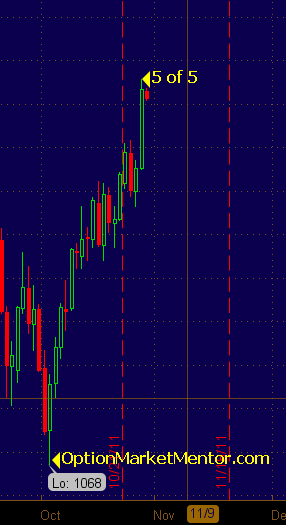 Between October 4 and October 27, 2011 It appears we've been parabolic up. By my Elliott Wave Count, we are working on a wave 5 of 5 of C which is a terminating wave. Lets do the math here - in 17 trading days the ES has traveled 221.25 points off of its' low. That is an astounding 20% gain from the October 4 lows.
While this rise might look parabolic, it is actually a pretty orderly move upwards. The daily candles don't tell the entire story. For that we need to look a little closer.
The three candle pattern that I highlighted last night as a potential reversal pattern was a false signal, and the futures contract went on to make a new high on the day.
20% in 17 days is an anomaly. Traders took profits into the close as a function of prudence. It's not yours until you book it. You would be surprised to know how many money managers forget that very simple fact.
Several key things happened today to cause the parabolic upside. First, the pro's faded the open (took contrarian positions). After the first initial down, we had a nice reversal and traders got caught short. Nothing like a short squeeze to force big gains fast. The entire morning I was hearing big money was not buying - unless it was an opportunistic trade but price continued to rise. Each time the ES printed a reversal candle it went on to make new highs. Why? How could we foretell this upside? Look at the chart below.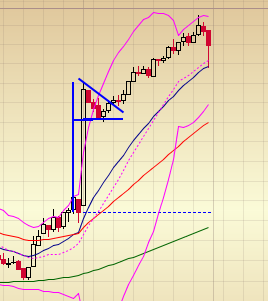
This is the opening print as seen on a 15 min chart. The clear white candle was the gap up open and the little candles in the pennant are the sell the gaps folks. This was a picture perfect bullish pattern with the pole being formed on high volume and the pennant on lower volume. From this we were able to determine our first price target by adding the length of the pole to the breakout. In this case, the pattern had a value of 31 points, added to the breakout level gave us a price target of 1301.
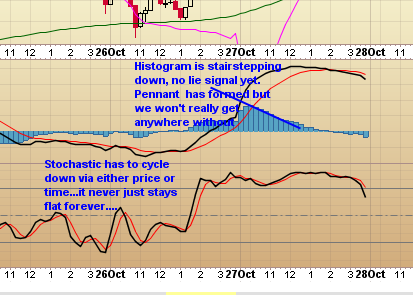
Does this mean I think Ms. Momentum will bat her falsies at Mr. Market tomorrow in her best come hither? No. Why? We are too far overbought to stage a sustained rally.
MACD and stochastic are divergent from price. In a normal price move environment, stochastic does not stay in this overbought position for more than a few hours at a time. It cycles down as a function of price and shows when the overbought condition has been resolved via time OR price. See the chart below? We were in the overbought status for most of the trading day, only getting a confirmed sell signal near the end of the day.
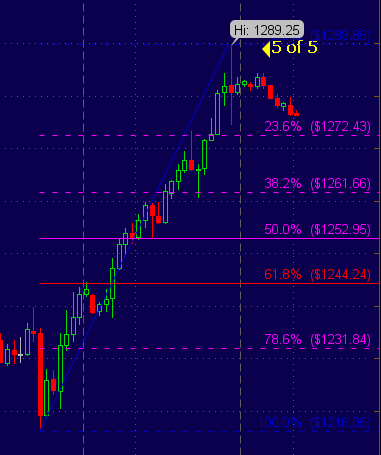
A trip back to 1262 would still have us in a bullish price pattern, and it would still be considered a "normal" retracement. The purpose of the retrace is to let price and momentum digest, and to pick up new money along the way. We have measured upside targets to 1293 and 1297. SPX 1301-1307.
I realize I flip in out of ES charts and SPX charts. They generally travel within 4 points of each other so I can watch either chart and trade either instrument. I track them both as they dance an intricate dance and I like to know who is leading.
My outlook for tonight and Friday is a flat to down trade with low volume retraces. I enter tomorrow short SPY, long TLT. The majority of my long exposure is in the form of bull put spreads which expire tomorrow.
I do not anticipate any major moves, and I will not be opening new option positions. Instead I will look to establish credit spreads for next week, and if we get jiggy with price I will trade it via the futures.
Suz