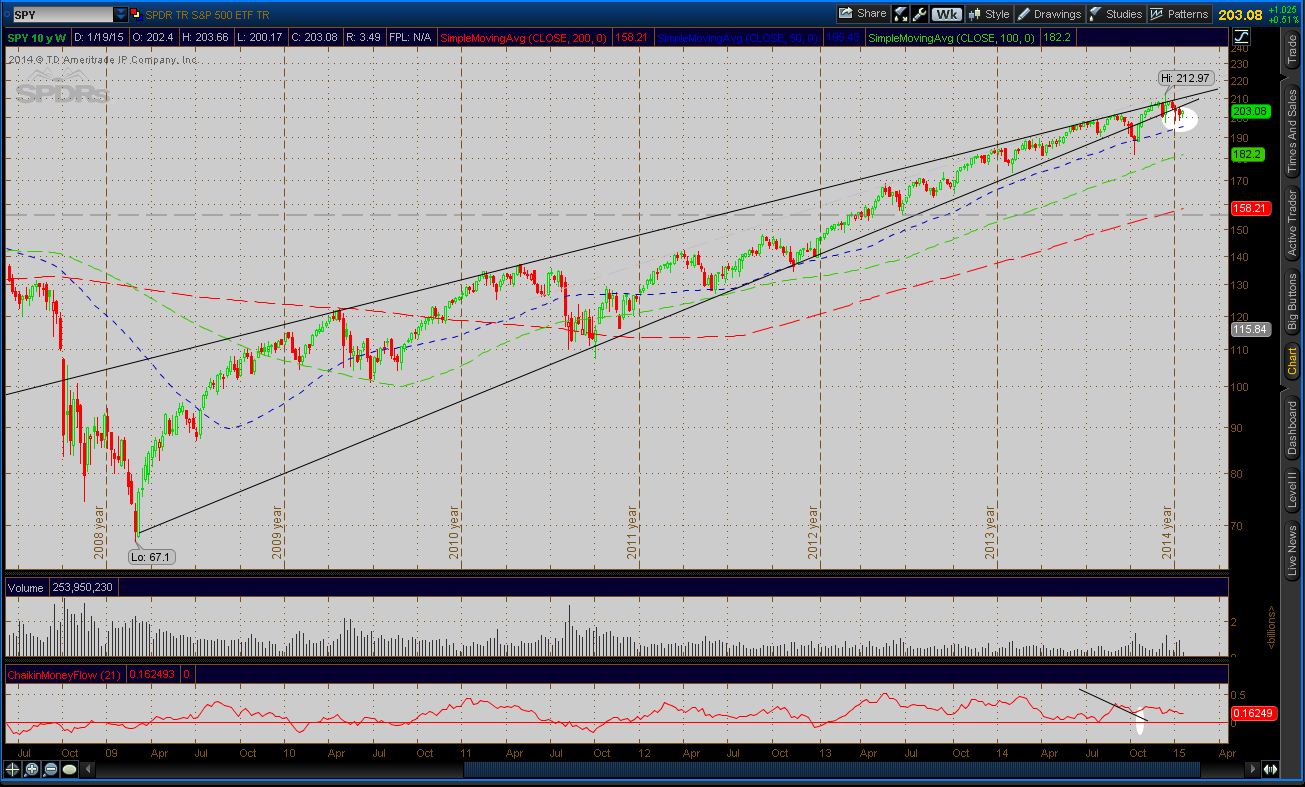
I haven't posted in a while as, despite all of the volatility, nothing has changed in a sense. The U.S. indexes have been unable to push decisively higher and appear to be continuing the topping behavior witnessed over the last year. The S&P (SPY) is marginally below support of the multi-year rising wedge I've been following, but there has not been a decisive breakdown.
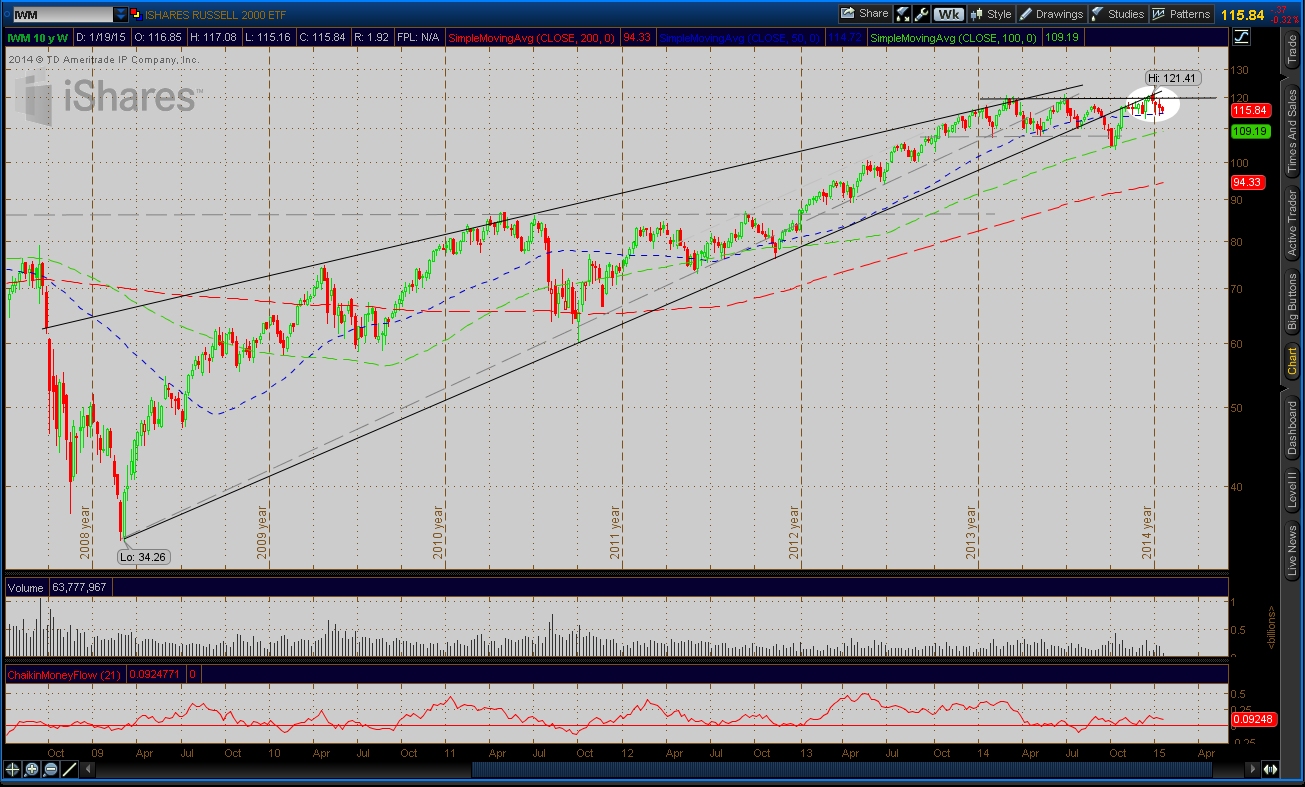
Small caps (IWM) have been interesting as they appears to be capped on the underside of a rising wedge.
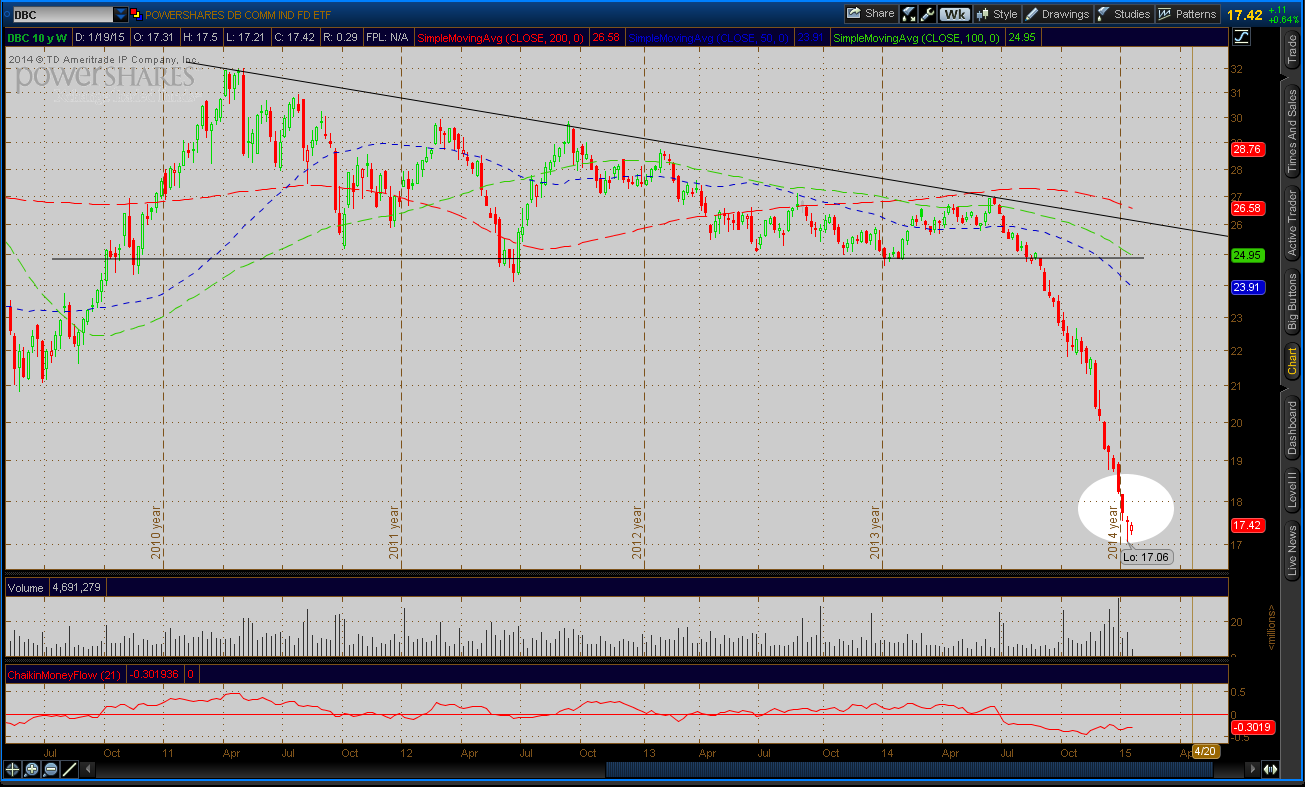
But the most interesting action appears to be in commodities and foreign markets. First, commodities. In general, they have been eviscerated. The commodities basket ETF, DBC, makes the point with a picture:
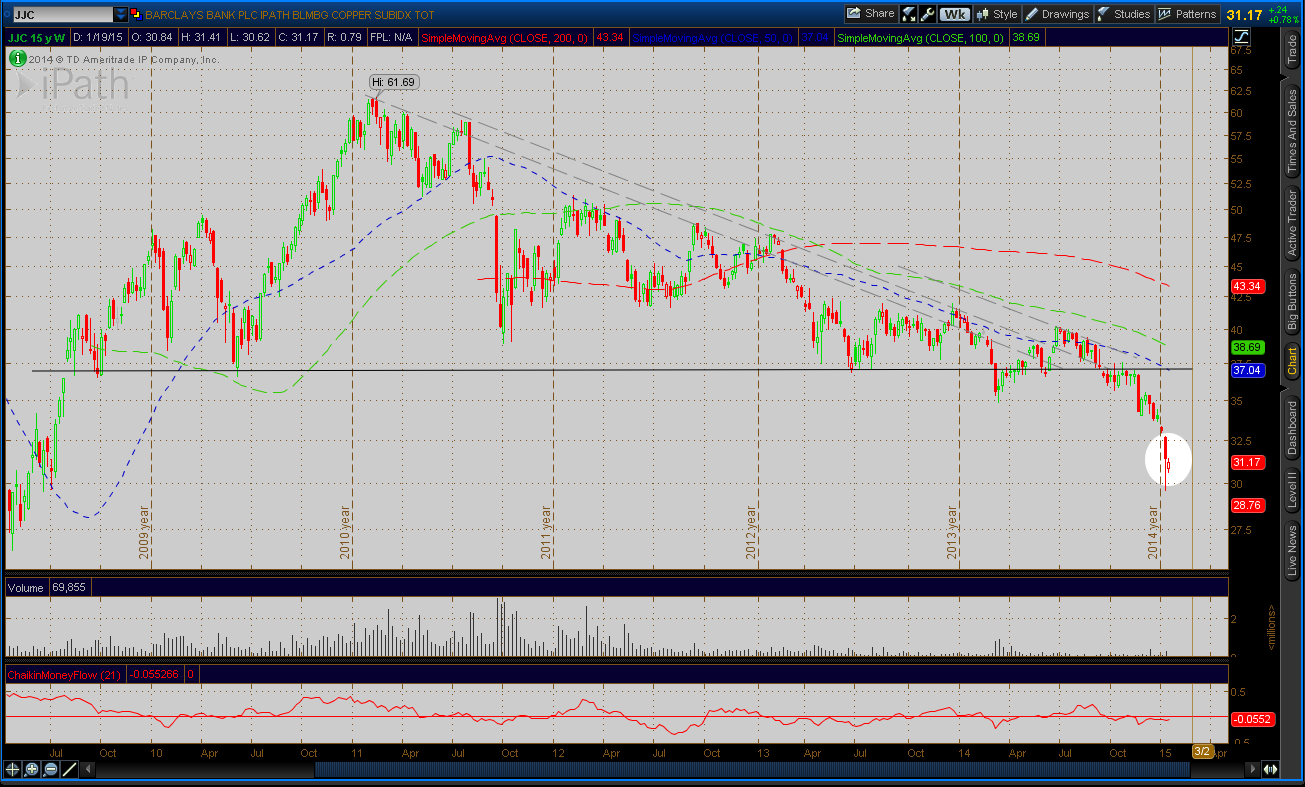
Copper (JJC), which I first shorted back in 2013, has finally broken down good and proper.
Of course, the plunge in oil makes copper's slide look like a tiny divot. I don't have a strong feeling about oil. Natural gas (UNG), however, has the makings of a long term inverted hand-and-shoulders pattern (this chart is Nat Gas futures, not UNG)... Very interesting.

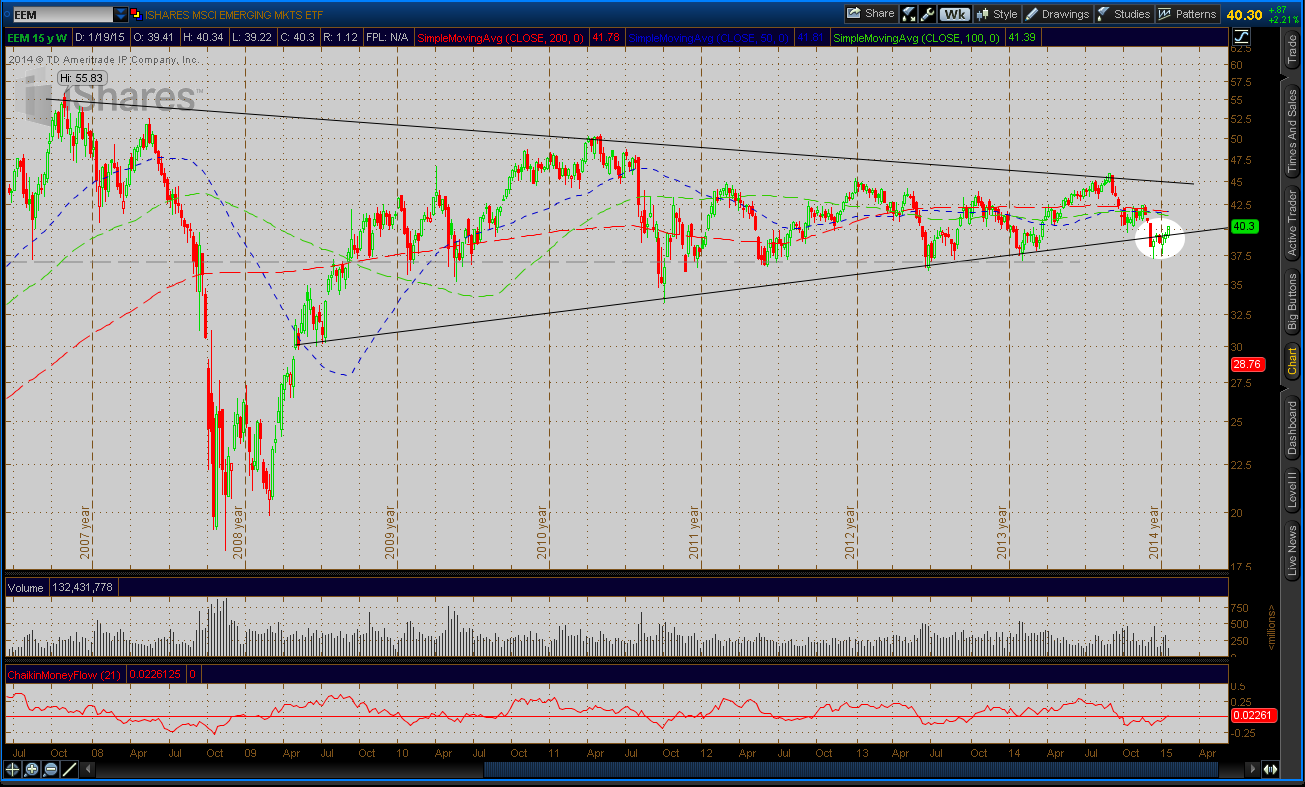
There are also interesting patterns to be found in many of the foreign markets that have been battered in recent months.
First, have a looked at the emerging markets basket ETF, EEM:
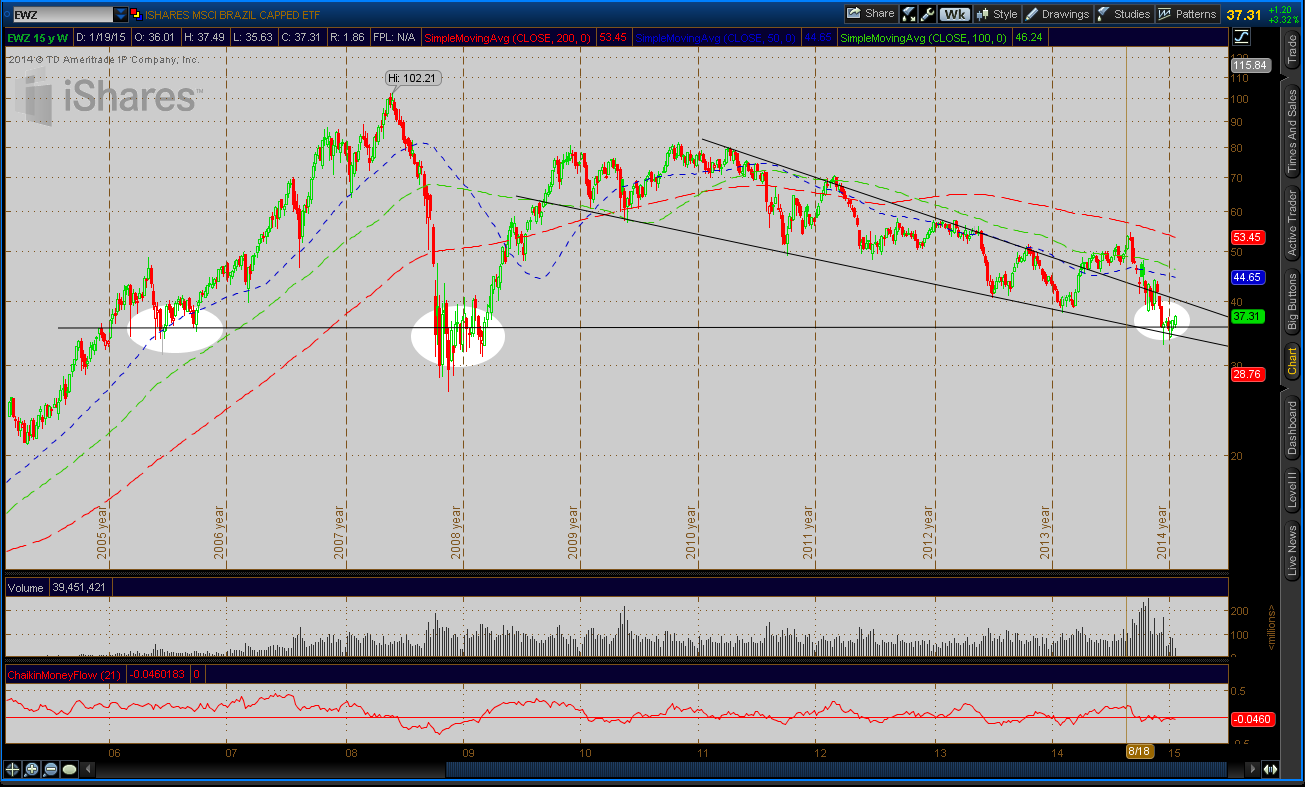
Brazil (EWZ) also appears to be at support.
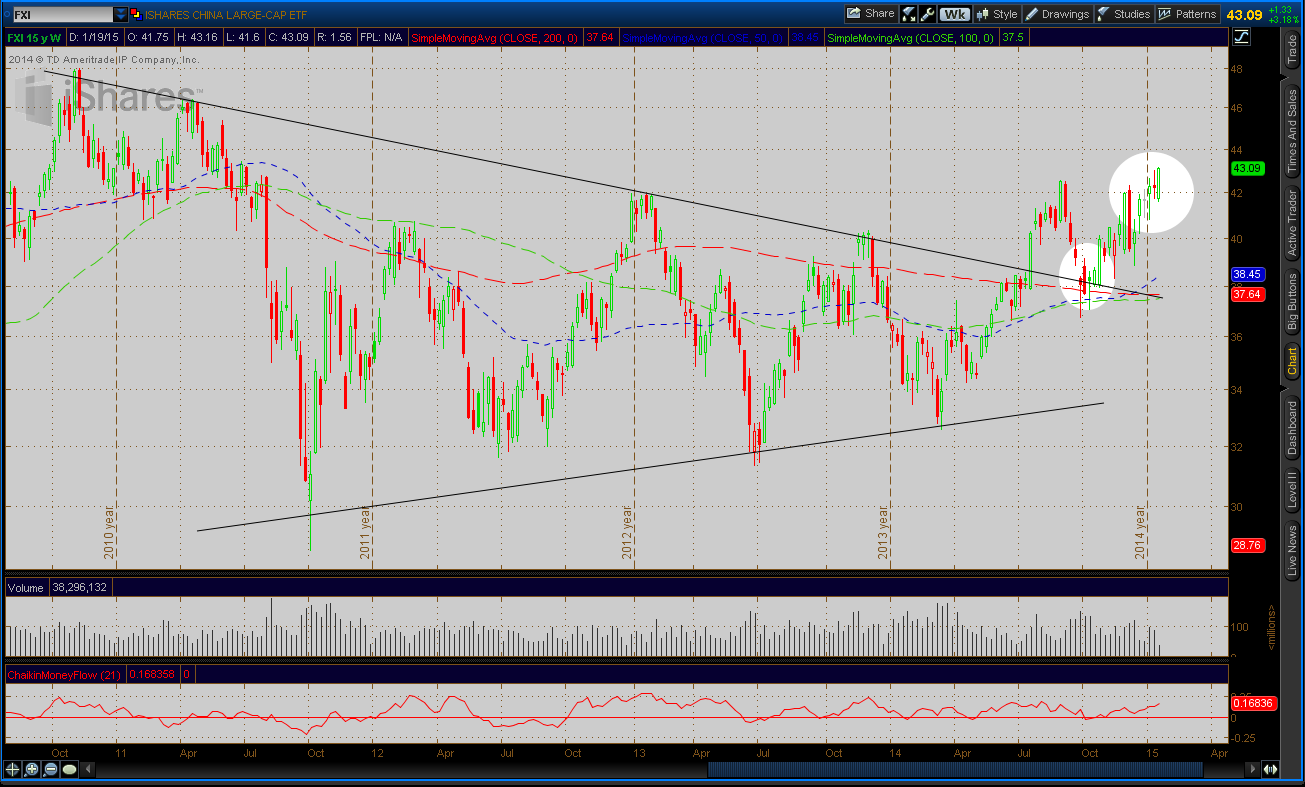
And China (FXI) looks to have broken out, pulled back to support and then surged to a new high. A pretty decent looking pattern if you are looking for a proven breakout.
Good luck trading all!