The S&P has staged a pretty fierce two day rally into week's end. The rally has taken the S&P right to a falling trendline that starts with the early April 2012 market top. Below is a chart using the S&P futures (/ES), which is trading about 5 points lower than the cash SPX. The current trendline of current resistance runs through market peaks in early may and mid-July. This is relatively minor resistance within what appears to be much larger pennant over the last 5 years (the thicker black lines are the framework of that pennant pattern).
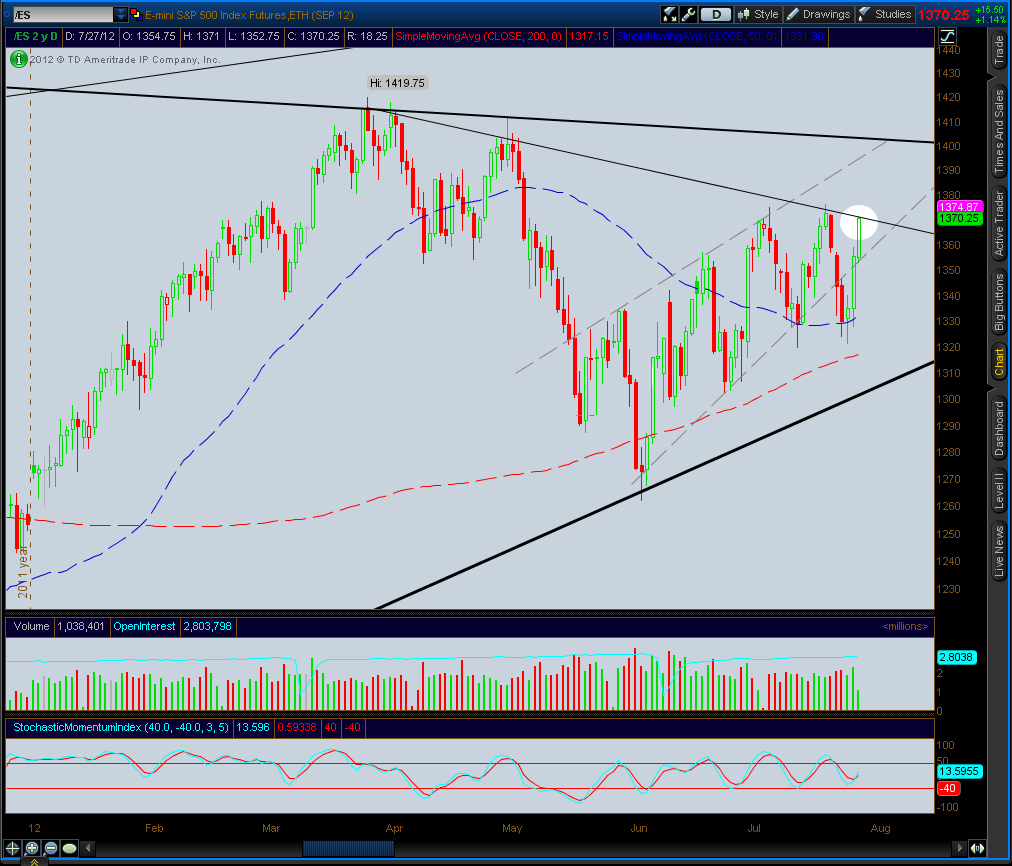
A break above this level would suggest that the S&P can run another 30 points, to the 1400 level. A pullback could have any number support levels before hitting critical support just above 1300.