Anthology of algorithmic trading: Lannett Company, Inc. (LCI), 5 November, 2015. Facts, Figures and Charts.
Summary: The algorithmic trading with the respective price manipulation is founded following the list of Features of the price pressure and the presence of active algorithmic trading, see the list below.
Price movement
On 5 November LCI lost 16.3% of its capitalization for one day with the day trade volume 6.5M shares, it corresponds 18% of its market capitalization and it is by 8-10 times more than the average day volume before. See please the Chart 1. Lannett Company, Inc. , price and volume.
As result
- Marginal and option traders lost their working capitals in part or at all.
- Value investors cannot see adequate behavior of the share and use traditional analytical methods, thus they cannot invest.
- Investors working with loans via banks have to add 1/6 of the share value to their portfolios.
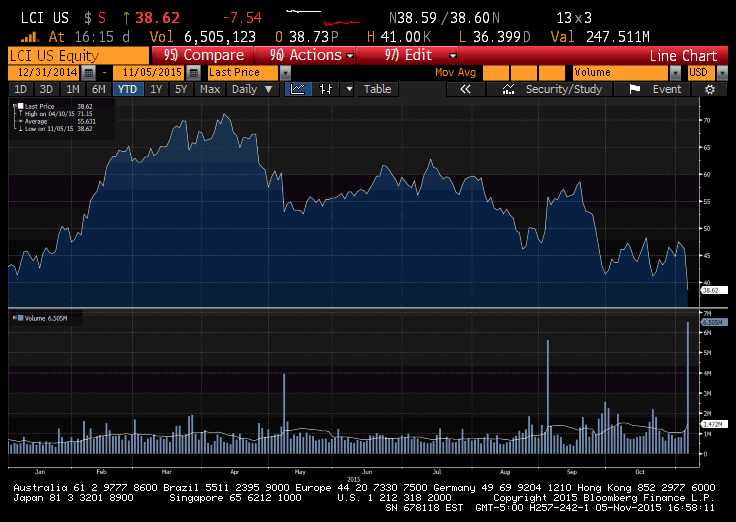
Chart 1. Lannett Company, Inc. price and volume, YTD.
About Lannett Company, Inc.
Lannett Company, Inc. manufactures and distributes pharmaceutical products under its own trade
name and under generic names. The Company also distributes competitive pharmaceutical
products manufactured by other companies. The principal products include antifungals, antacids,
dermatological preparations, and analgesic sedatives.
LCI's EPS and Revenue are shown on the Chart 2.
P/E=9.55, ROE=39.6%, Short Interest=39% of Float.
The Source: Bloomberg.
The company reported results on 4 November after market close. Lannett 1Q EPS is 99c, est. 89c. 1Q revenue is $106.4M, est. $103.8M. Thus, the company tops estimates. The interesting fact is that LCI down 14% post-mkt after 460k shrs traded and then "just" additional 2% for the trading day and 6M shares volume.
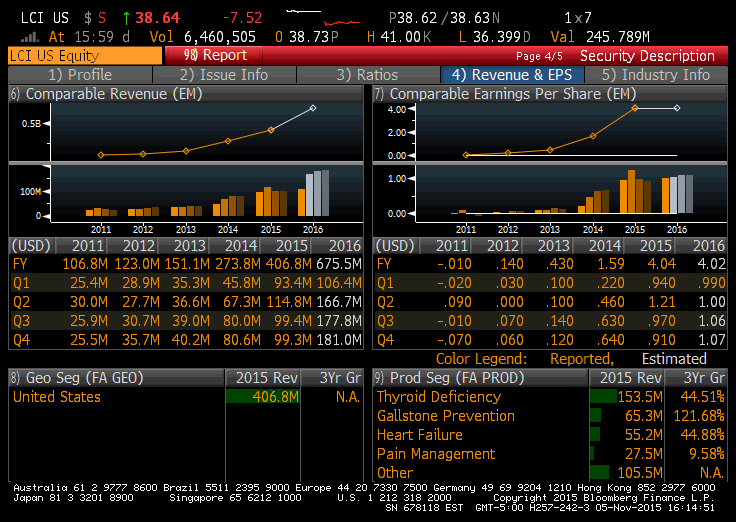
Chart 2. LCI: Revenue and EPS.
The company looks like very undervalued in its group with EPS 1Y Gr 145.88%. See please the Chart 3. LCI: Relative valuation.
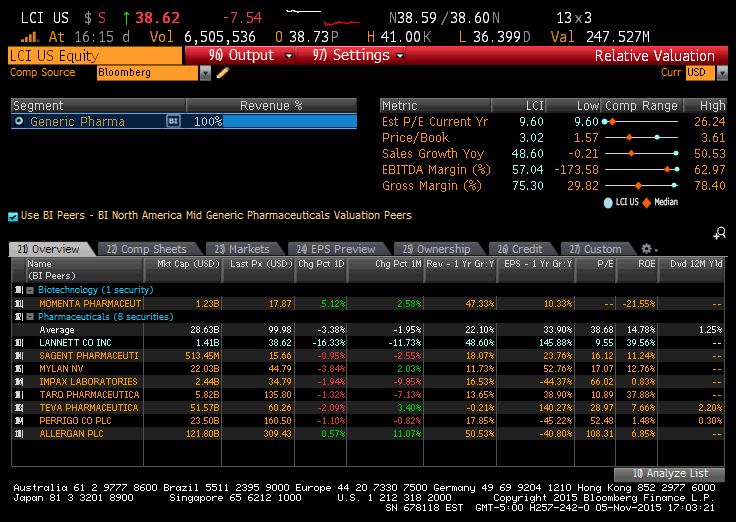
Chart 3. LCI: Relative valuation.
The trading details
The maximal day volume on the 5th of November 99K shares did CreditSwiss, KCG - 81K shares, Fidelity Capital Markets - 69K shares and UBS - 56K shares. These investment banks and brokers were owners of 20.469K, 19.743K, 175.998K and 98.901 LCI shares, respectively.