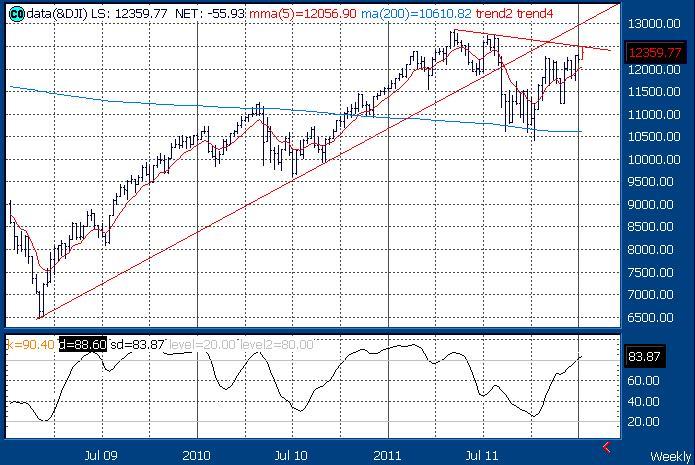
Last week the Dow Industrial Average tested my quarterly risky level at 12,478 on Tuesday, and in addition the weekly chart shows overbought weekly MOJO and a down trend at 12,500 that connects the highs of May and July 2011. A breakout above this trend puts the focus on the other quarterly risky levels for the other major averages at; 1305.3 SPX, 2777 NASDAQ, 2422 NDX, 5448 Dow Transports, 829.03 Russell 2000 and 390.17 SOX. A weekly close below my annual pivot at 12,312 on the Dow Industrials provides the warning for first quarter stock weakness. The yield on the 10-Year is influenced by its 50-day simple moving average at 1.984 and my semiannual pivot at 1.903. Gold continues to have difficulty with its 200-day at $1627.9. Crude oil tested my zone of annual and semiannual risky levels at $103.58 and $104.84 last Wednesday and Thursday. The euro versus the dollar is trading around this month’s pivot at 1.2780 with my quarterly value level at 1.2499 and semiannual pivot at 1.2980.
10-Year Note – (1.961) My annual value level is 2.502 with my semiannual pivot at 1.903, and daily, weekly, quarterly, monthly and semiannual risky levels at 1.883, 1.885, 1.687, 1.409 and 1.385.
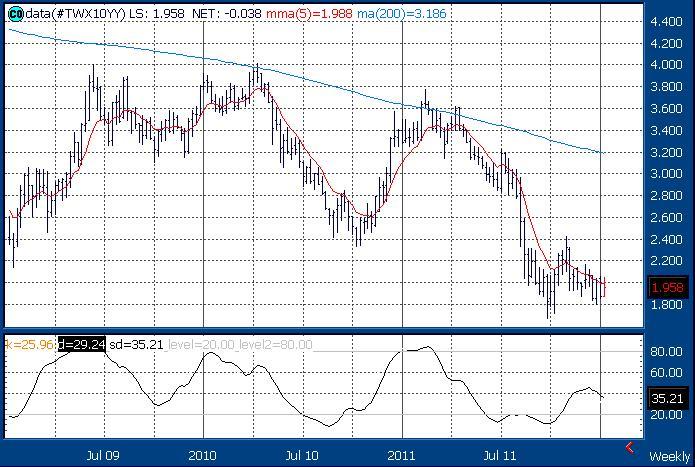
Courtesy of Thomson / Reuters
Comex Gold – ($1617.6) Daily, annual and weekly value levels are $1577.8, $1575.8, $1388.4 and $1517.4 with semiannual risky levels at $1635.8 and $1659.5, and monthly and quarterly risky levels at $1706.7 and $1740.9.
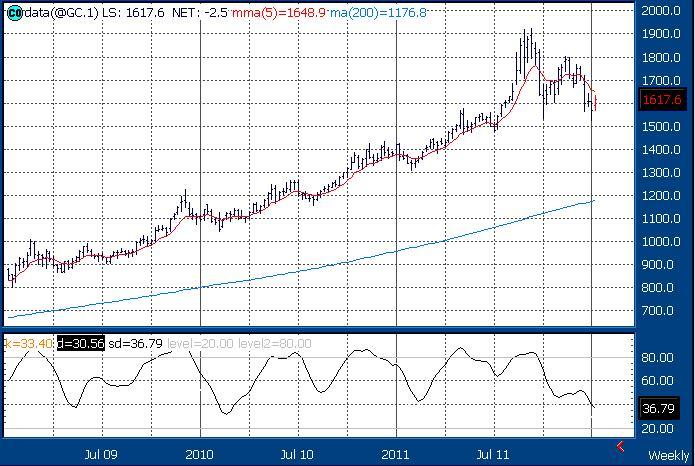
Courtesy of Thomson / Reuters
Nymex Crude Oil – ($101.78) My semiannual and monthly value levels are $79.83 and $75.53 with monthly and weekly pivots at $99.87 and $98.89, a daily pivot at $102.65, semiannual and annual risky levels at $104.84, and $103.58 and $117.00.
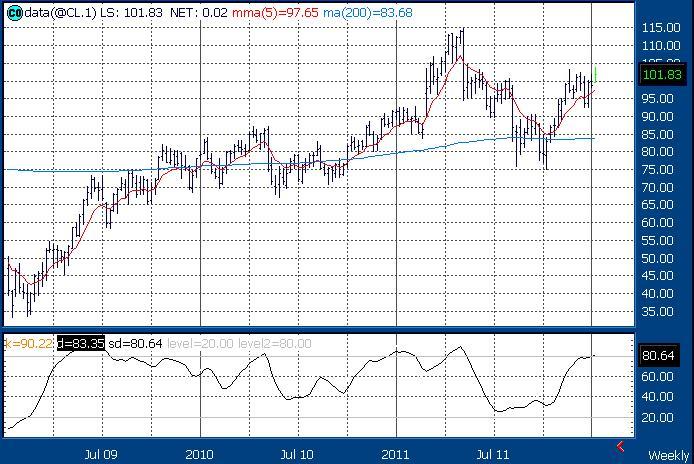
Courtesy of Thomson / Reuters
The Euro – (1.2720) Quarterly and weekly value levels are 1.2499 and 1.2467 with daily, monthly and semiannual pivots at 1.2766, 1.2780 and 1.2980, and annual and semiannual risky levels at 1.4239 and 1.4405.
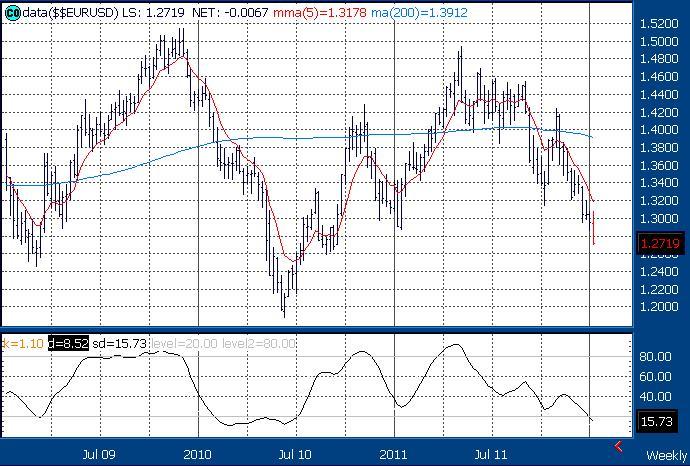
Courtesy of Thomson / Reuters
Weekly Dow: (12,360) Weekly, monthly and semiannual value levels are 11,920, 11,210, 8,425 and 8,336 with annual and daily pivots at 12,312 and 12,350, and quarterly and annual risky levels at 12,478 and 14,032.
.
Courtesy of Thomson / Reuters
S&P 500 – (1277.8) Weekly, monthly and semiannual value levels are 1218.8, 1152.8, 841.7 and 829.9 with a daily pivot at 1273.9, and quarterly and annual risky levels at 1305.4, 1363.2 and 1562.9.
NASDAQ – (2674) Weekly, monthly and semiannual value levels are 2525, 2432, 2012 and 1952 with a daily pivot at 2659, and annual, quarterly and annual risky levels at 2698, 2777 and 3232.
NASDAQ 100 (NDX) – (2356) Weekly, monthly and semiannual value levels are 2209, 2185, 1851 and 1743 with daily and annual pivots at 2343 and 2300, and quarterly and annual risky levels at 2422 and 2603.
Dow Transports – (5069) Weekly, monthly and semiannual value levels are 4888, 4443, 4407 and 3778 with a daily pivot at 5046, and quarterly and annual risky levels at 5448, 5861 and 6111.
Russell 2000 – (749.71) Weekly, monthly and semiannual value levels are 716.79, 646.71, 572.90 and 510.81 with a daily pivot at 746.19, and quarterly and annual risky levels at 829.03, 836.15 and 969.09.
The SOX– (375.22) Weekly, monthly, annual and semiannual value levels are 342.16, 310.48, 269.80, 277.90 and 194.47 with a daily pivot at 369.79, and quarterly and annual risky levels at 390.17 and 520.61.
Equity Fundamentals – Stocks remain fundamentally cheap.
- 74.9% of all stocks are undervalued / 25.1% of all stocks are overvalued. On October 4th - 93.5% of all stocks were undervalued.
- All sixteen sectors are undervalued, fourteen by double-digit percentages (11.6% to 19.0%). Back in March 2009 the sectors were undervalued by 33% to 45%. – Check out and subscribe to www.ValuEngine.com.
VE Morning Briefing – If you want expanded analysis of the US Capital Markets including a Fearless Prediction of the Week and a Stock of the Day go to this link and sign up: http://www.valuengine.com/nl/mainnl?nl=D
ValuTrader Model Portfolio – If you want to learn how to “Buy and Trade” use this link and sign up: http://www.valuengine.com/nl/mainnl?nl=V
ETF Weekly – If you want my Value Levels and Risky Levels for 30 Electronically Traded Funds use this link and sign up: http://www.valuengine.com/nl/mainnl?nl=U
ValuEngine FDIC Evaluation Report – In this report I slice and dice the FDIC Quarterly Banking Profile. We publish a ValuEngine List of Problem Banks in this publication: http://www.valuengine.com/nl/mainnl?nl=C The December FDIC report with complete analysis of the Q3 Quarterly Banking Profile is now available. I track the continuing slow improvement to the housing market and banking system, but recognize that we are not out of the war.
ValuEngine Capital Management - Over the years many of my readers have asked for investment help based upon ValuEngine and my technical analysis expertise. This is now possible through VE Capital Management LLC. If you are a Registered Investment Advisor looking for new products to offer to your clients, let me know. If you have any questions, please respond to this email.
Definition of MOJO – This is my term for technical momentum. I use what’s called “12x3x3 slow stochastic readings” from daily, weekly and monthly charts. The scale is zero to 10.0 where above 8.0 is overbought and below 2.0 is oversold.
Buy and Trade Strategies for Long Positions
- Value Level – The price at which you establish an additional long position on share price weakness. This is done on a GTC Limit Order to buy weakness to the Value Level.
- Risky Level – The price at which you remove a single long position or reduce a multiple long position on share price strength. This is done on a GTC Limit Order to sell strength to the Risky Level.
Buy and Trade Strategies for Short Positions
- Value Level – The price at which you remove a single short position or reduce a multiple short position on share price weakness. This is done on a GTC Limit Order to buy weakness to the Value Level.
- Risky Level – The price at which you establish an addition short position on share price strength. This is done on a GTC Limit Order to sell strength to the Risky Level.
Richard Suttmeier
Chief Market Strategist
Chief Market Strategist
ValuEngine.com
(800) 381-5576
(800) 381-5576
To unsubscribe from this free email newsletter list, please click http://www.valuengine.com/pub/Unsubscribe?
Send your comments and questions to Rsuttmeier@Gmail.com. For more information on our products and services visit www.ValuEngine.com
As Chief Market Strategist at ValuEngine Inc, my research is published regularly on the website www.ValuEngine.com. I have daily, weekly, monthly, and quarterly newsletters available that track a variety of equity and other data parameters as well as my most up-to-date analysis of world markets. My newest products include a weekly ETF newsletter as well as the ValuTrader Model Portfolio newsletter. You can go to http://www.valuengine.com/nl/mainnl to review sample issues and find out more about my research.
“I Hold No Positions in the Stocks I Cover.”
Disclosure: I have no positions in any stocks mentioned, and no plans to initiate any positions within the next 72 hours.