TUESDAY, FEBRUARY 26, 2013
A Technical EchoVector Look At The Stock Market:
DIA, DJIA, DJX, /YM Futures Basis:
Active Annual, Bi-Quarterly, And Quarterly EchoVectors And Forecast EchoVectors
From Key Pivot Point EchoBackDates
For The Week of Monday 25 February 2013
Feb 25, 2013 1:31 PM | about stocks: SPY, SH, SSO, SDS, QQQ, PSQ, QLD, QID,IWM, RWM, UWM, UKK, TWM, DIA, DOG, DDM, DXD, TLT, TLH, IEF, UUP, UDN,GLD, GTU, DGZ, UGL, DZZ, GLL, IAU, SGOL, SLV, DBS, AGQ, ZSL, CU, PALL,PPLT
/YM Chart: Dow 30 Industrial Average E-mini Futures:
A 12-Month Daily OHLC Chart with Key EchoVectors, Forecast EchoVectors, and Echo-Back Dates Illustrated:
A Chart With Active and Key Annual, Bi-Quarterly, and Quarterly EchoVectors And Coordinate Forecast EchoVectors From Key Or Select Pivot Point EchoBackDates and Downside or Upside Pivot Extension Vectors Generated From Key Coordinated Focus Echo-Back Time Points.
Coordinated Echo-Back Time Points:
1. Monday Feburary 2013's Quarterly and Bi-Quarterly Monday EchoBackDates
Colors Of Coordinated EchoVectors Illustrated On Chart
Solid Yellow:Annual EchoVector (AEV)
Dotted Yellow: Annual Coordinate Forecast EchoVectors
Solid White: Bi-Quarterly EchoVector (2QEV)
Dotted White: Bi-Quarterly Coordinate Forecast EchoVectors
Solid Green: Quarterly EchoVector (QEV)
Dotted Green: Quarterly Coordinate Forecast EchoVectors
Solid Blue: Pivot Downside Echo-Vector Extension Weakness (2QEV and QEV) Coming Before Re-Pivot Up-side And Correcting Rally Into Coming Options Expiration Week.
Solid Pink: Annual Echo Time-Frame Before Key May Sell-off.
(Click on chart to enlarge and click on chart again to open new tab then click on chart in new tab to zoom)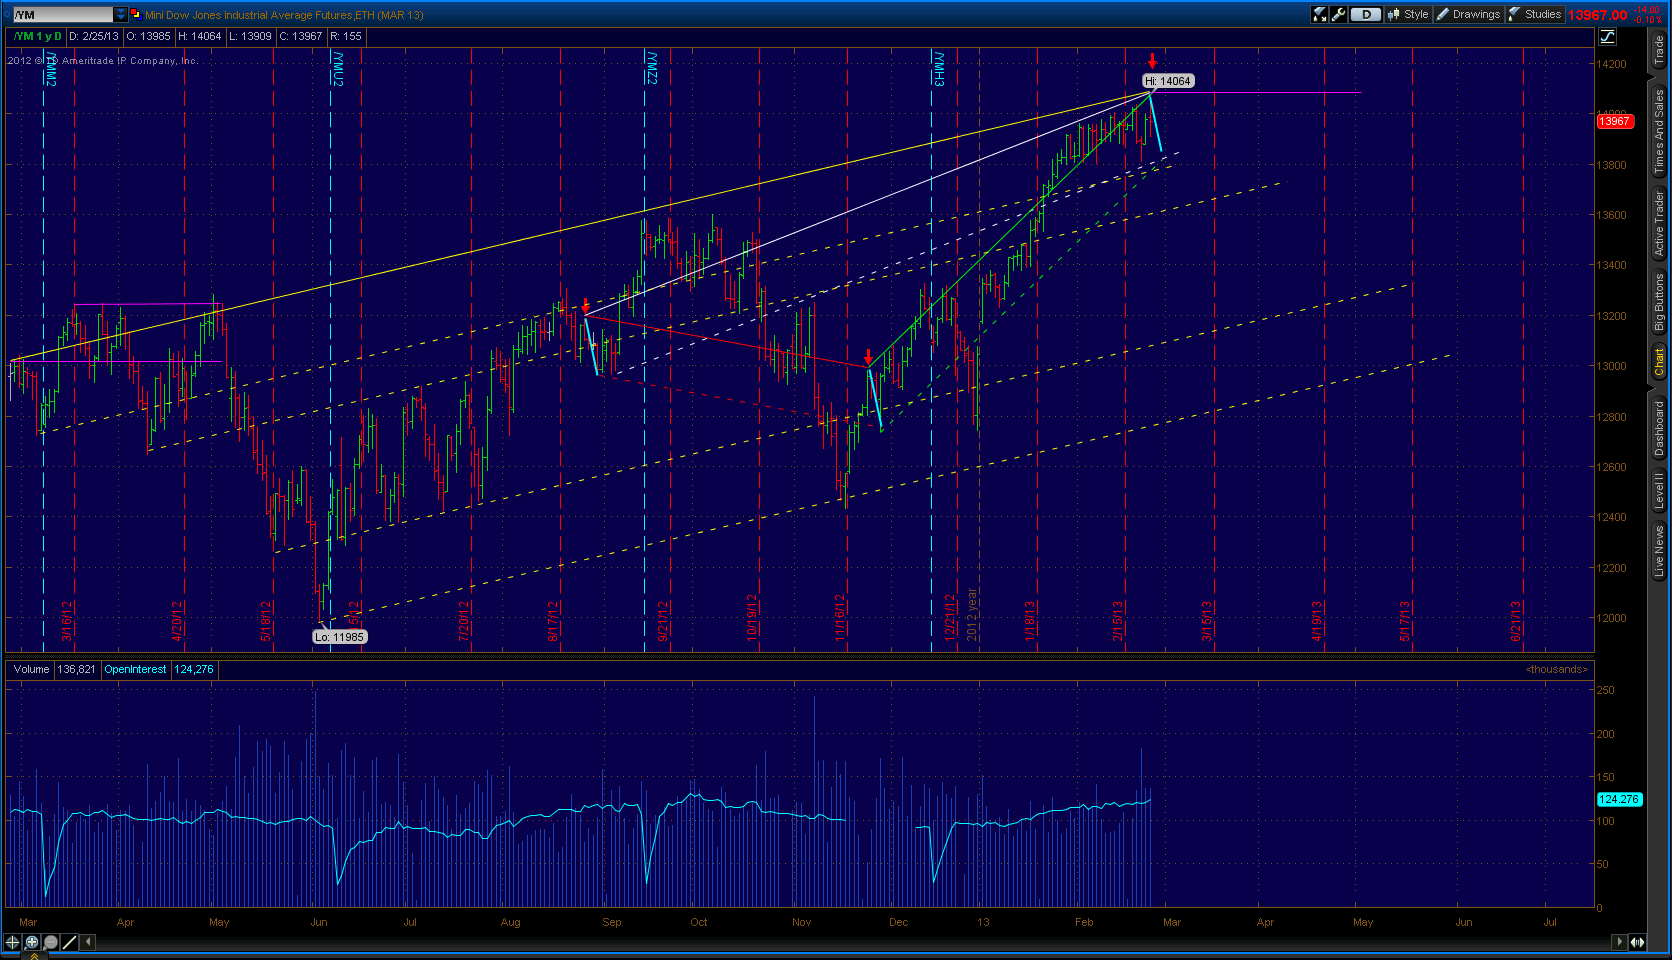
FOR FURTHER EXTENDED ANALYSIS AND COMMENTARY
See article, Dow Chart: Toppy Or Not?, at
http://echovectorvest.blogspot.com/2013/02/dow-chart-toppy-or-not-next-months.html,
and more market Commentary References at
http://www.echovectorvest.com/Commentary.html
Posted by EchoVectorVEST at 9:42 AM 
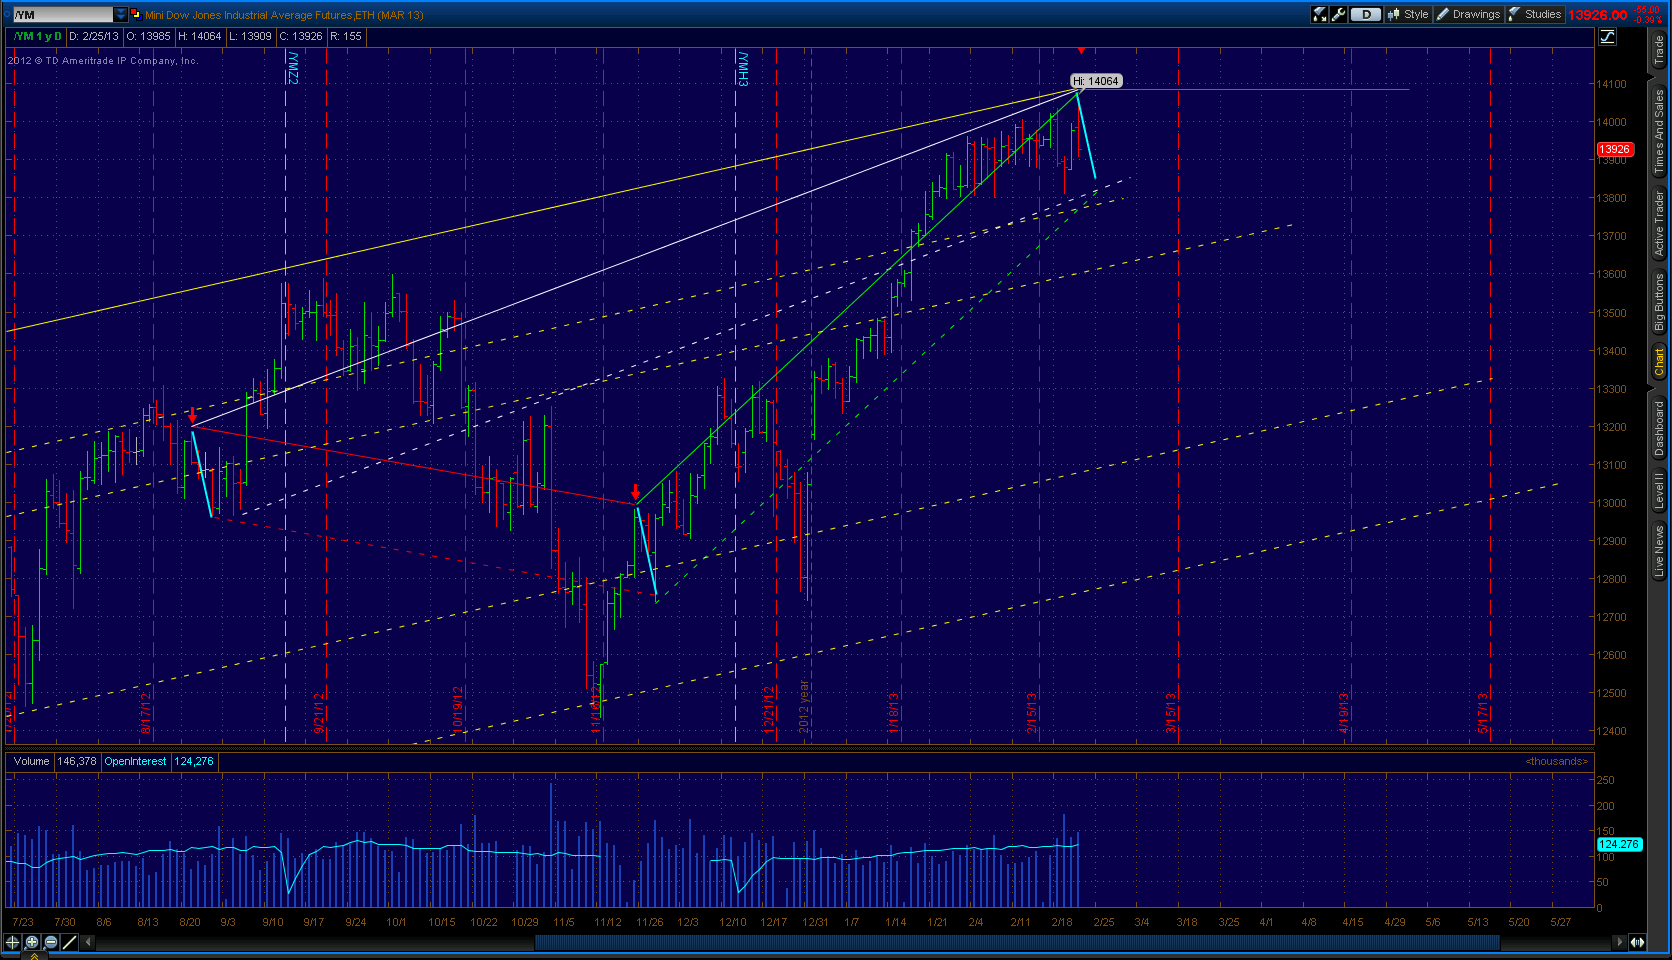
A 12-Month Daily OHLC Chart with Key EchoVectors, Forecast EchoVectors, and Echo-Back Dates Illustrated:
A Chart With Active and Key Annual, Bi-Quarterly, and Quarterly EchoVectors And Coordinate Forecast EchoVectors From Key Or Select Pivot Point EchoBackDates, With Downside or Upside Pivot Extension Vectors Generated From Key Coordinated Focus Echo-BackTime Points Included.
Coordinated Echo-Back Time Points:
1. Monday Feburary 2013's Quarterly and Bi-Quarterly Monday EchoBackDates
Colors Of Coordinated EchoVectors Illustrated On Chart
Solid Yellow:Annual EchoVector (AEV)
Dotted Yellow: Annual Coordinate Forecast EchoVectors
Solid White: Bi-Quarterly EchoVector (2QEV)
Dotted White: Bi-Quarterly Coordinate Forecast EchoVectors
Solid Green: Quarterly EchoVector (QEV)
Dotted Green: Quarterly Coordinate Forecast EchoVectors
Solid Blue: Pivot Downside Echo-Vector Extension Weakness (2QEV and QEV) Coming Before Re-Pivot Up-side And Correcting Rally Into Coming Options Expiration Week.
Solid Pink: Annual Echo Time-Frame Before Key May Sell-off
(Click on chart to enlarge and click on chart again to open new tab then click on chart in new tab to zoom).
FOR FURTHER EXTENDED ANALYSIS AND COMMENTARY
See article, Dow Chart: Toppy Or Not?, at
http://echovectorvest.blogspot.com/2013/02/dow-chart-toppy-or-not-next-months.html,
and more market Commentary References at
http://www.echovectorvest.com/Commentary.html
Posted by EchoVectorVEST at 9:54 AM
TUESDAY, FEBRUARY 26, 2013
DOW CHART: TOPPY OR NOT?
Next month's options expiration, coming March 15TH, marks the one-year anniversary of the spring 2012's momentum price top for large cap composite equity indexes, as measured by the Dow 30 Industrial Average.
Although this 2012 mid-March price momentum top was re-touched again several times later that March and April, significant lower lows also followed. These lower lows continued until a market bottom for the year was reached in early June, with an almost 10% sell-off in the Dow having occurred.
Prices had fallen from a seasonal high of just over $132, to a June (early) low of $120.19, measured by the DIA ETF. It then took the rest of June, July, and part of August to recover back these gains. On the strength of this price recovery (fueled significantly by Central Bank action and intervention) the DIA climb an additional 2.5% into September, but only to collapse again to near prior summer lows by November, a pattern very similar to prior year price activity.
However, since November 2012, and further keeping with this annual price action pattern, the DIA has gained a remarkable 16% into the present month of February 2013.
With these strong gains since November, some market bears are suggesting the time is now ripe for large cap stocks to begin to correct again, especially after this impressive and extensive level of price recovery and gain. Many bears are considering both seasonality, and relatively lofty current price levels, in their assessments, as well as caution from additional pressures from a relatively faltering European market.
Market bulls, on the other hand, are pointing to things like potential commodity (industrial factor input) price destruction, increased equity demand inflows as an alternative to faltering bonds, and continued aggressive central bank financial engineering, to keep upward market price momentum going. Some bulls also point to the cyclical market benefits that often accompany the second term phase of a Presidency as well.
I believe this coming month of trading, and well into the March 15TH options expiration, could be very revealing regarding the possible continuation of positive market price momentum into this spring, and later into this summer.
I suggest focusing closely on price action and relative strength during the period that spans a week and a half preceding March 15TH, and the two to three week period that immediately follow expiration (particularly the 12 trading days after March 15TH, and beyond).
A review of my attached chart of the Dow 30 Industrials E-mini Futures might suggest that a period of potential opportunity on the long side (ceteris paribus) starting the first Tuesday of March, and going into March expiration, might be forthcoming. This long opportunity may then be followed by potential cautionary period, perhaps even a period warranting a good look at the possible employment of large cap portfolio insurance (especially following the 12TH trading day after the March 15TH expiration), if not an outright shorting opportunity period.
I also believe price action over the next 4 weeks may also help foreshadow what price levels the key cyclical price support, and subsequent market up-move later this year may launch from, regarding a broadly anticipated Regime Change Cycle (8 year) price low potentially due this October.
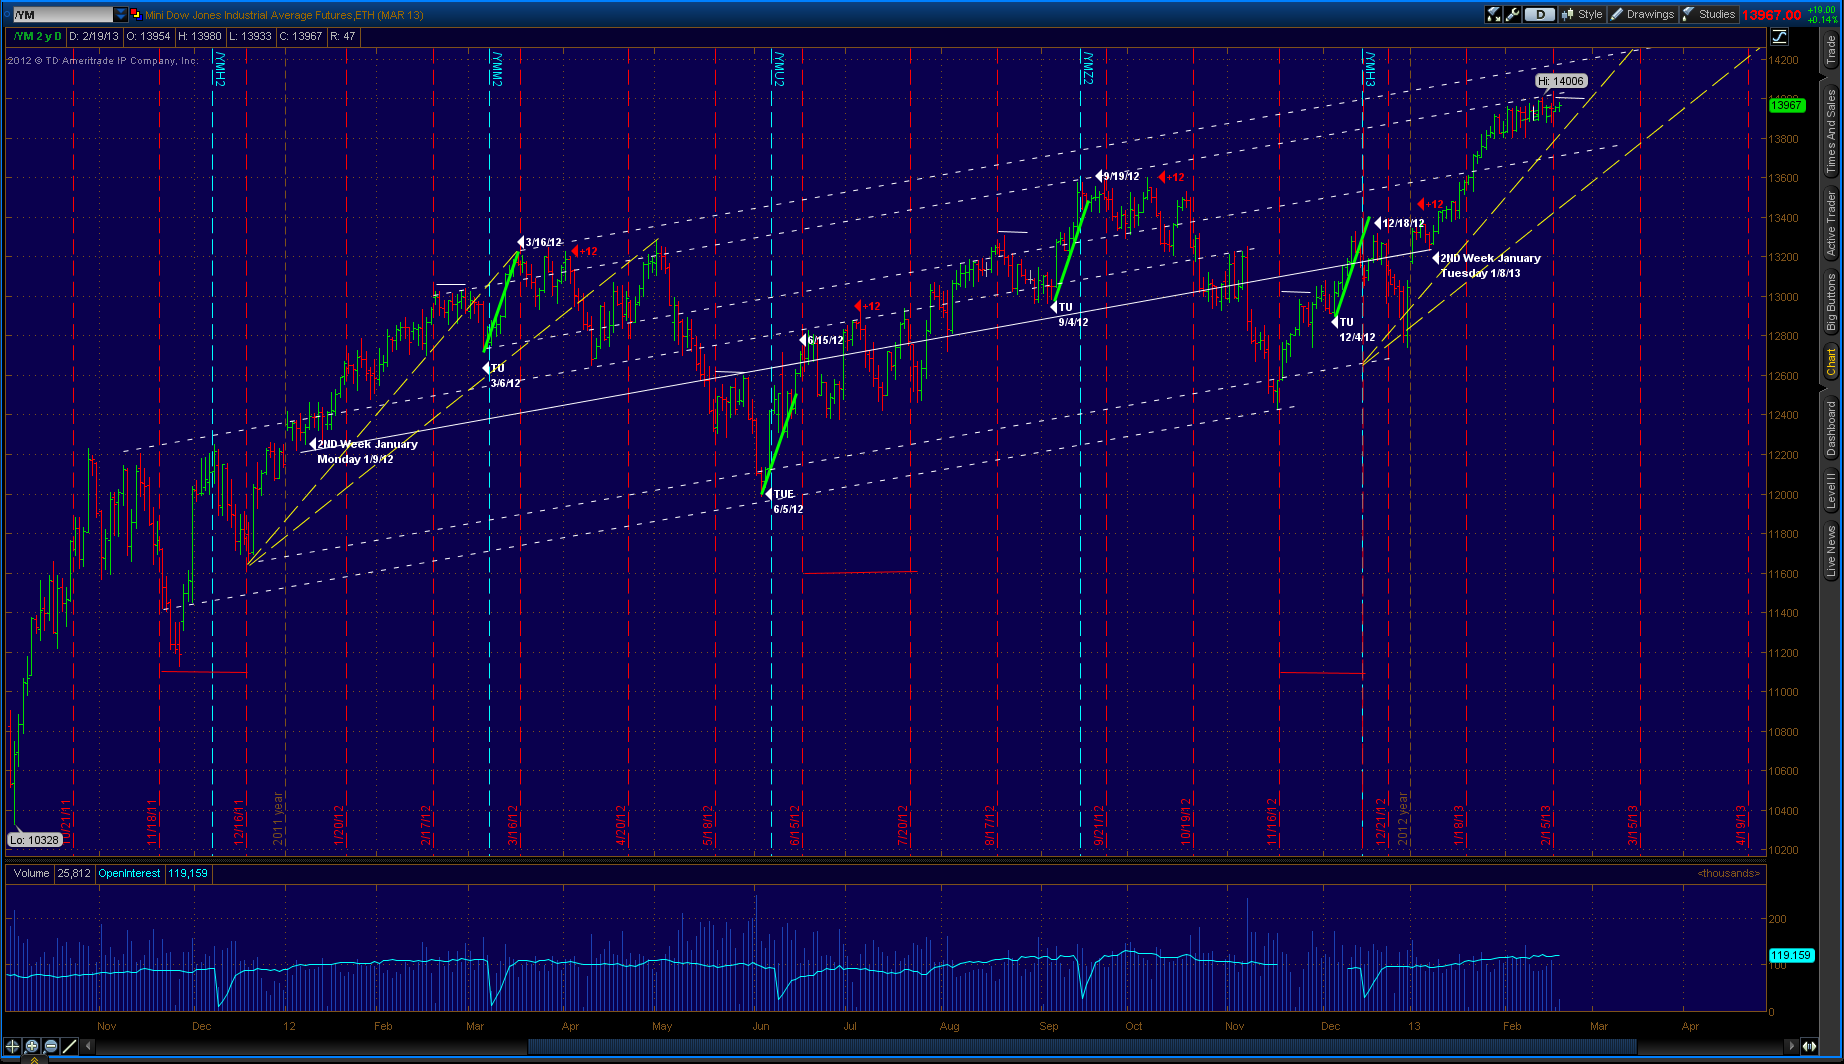
/YM Chart: Dow 30 Industrial Average E-mini Futures:
A 16-Month Daily OHLC Chart with Key Annual EchoVectors
and Quarterly Echo-Back Dates Illustrated
A Chart With Active Annual Price Vectors And Select Quarterly Echo-Strength Vectors Illustrated Generated From Key Coordinated Focus Echo-Back Time Points.
Coordinated Echo-Back Time Points:
1. 2ND Week if February, 2012, to 2ND Week if February, 2013, and
2. Week Preceding Options Expiration (Tuesday), March, June, September and December 2012.
Colors Of Coordinated EchoVectors Illustrated On Chart
Solid White: Annual EchoVector (QEV)
Dotted White: Annual Coordinate Forecast EchoVectors
Solid Green: Echo-Strength Vectors From First Tuesday of Month Coming Before Key Options Expiration Week.
(Click to enlarge and click again to zoom)
Disclosure: I have no positions in any stocks mentioned, and no plans to initiate any positions within the next 72 hours.
Feb 22, 3:51 PM
DIA CHART: 1-YEAR DAILY OHLC: TRADER'S EDGE EASYGUIDECHART: Great Success By EchoVectorVEST MDPP Model In Composite Equities Forecast Today [Edit or Delete]0 comments
Feb 22, 2013 3:51 PM | about stocks: SH, SSO, SDS, QQQ, PSQ, QLD, QID, IWM,RWM, UWM, UKK, TWM, DIA, DOG, DDM, DXD, TLT, TLH, IEF, UUP, UDN, GLD,GTU, DGZ, UGL, DZZ, GLL, IAU, SGOL, SLV, DBS, AGQ, ZSL, CU, PALL, PPLT
DIA ETF 1-YEAR DAILY OHLC
WITH KEY BIQUARTERLY ECHOVECTOR AND ECHOBACKDATE
(Click to enlarge and click again to zoom)

FOR FURTHER EXTENDED ANALYSIS AND COMMENTARY
See
A Closer Technical Look At The S&P500 Spyder Futures And The DJIA Spyder ETF Today
and article, Dow Chart: Toppy Or Not?, at
http://echovectorvest.blogspot.com/2013/02/dow-chart-toppy-or-not-next-months.html,
OTAPS ALERT at
http://echovectorvest.blogspot.com/2013/02/blog-post_5845.html,
and more market Commentary References at
http://www.echovectorvest.com/Commentary.html
PROTECTVEST AND ADVANCEVEST BY ECHOVECTORVEST MDPP
![]()
Providing Forecasting and Trade Management Technology, Analysis, and Education Consistent With More Than Doubling the Portfolio Position Value of The Major Market(Dow 30 Industrials, DIA ETF) From Mid-2007 to Early 2009!... More Than Doubling Again from Early 2009 through 2010!... Then More Than Doubling Again in 2011!... And Then More Than Doubling Again in the First Half of 2012!... "We're keeping watch for you!"

FORECAST MODEL & ALERT PARADIGM & ACTIVE ADVANCED MANAGEMENT & TRADE TECHNOLOGY
For information on EchoVectorVEST MDPP Active Advance Management Trade Technology and Active Advance Management Position Value Optimization Methodology see:
http://echovectorvest.blogspot.com/2012/05/on-off-through-vector-target.html
*Daytraders interested in shorter-term market mechanics and OTAPS ALERTS also taking advantage of intra-day time-horizon price deltas and advanced OTAPS position management technologies for the DIA, GLD, and USO, also see:
http://www.echovectorvest.blogspot.com/
Also see Chronologies and Summaries and Results for the EchoVectorVEST MDPP Major Price Delta and Price Pivot ALERTS for the Gold Metals Market (GLD ETF /GC Futures) and the Crude Oil Market (USO ETF and /QM and /CL Futures) in Q2, 2012, and in Q1.
EchoVectorVEST MDPP: Powerful Results From A Powerful, Active, and Advanced Forecast And Position Management Methodology.
________________________________________________________
PROTECTVEST AND ADVANCEVEST BY ECHOVECTORVEST MDPP
"We're keeping watch for you."
________________________________________________________
FOR TODAY'S KEY CHARTS AND ANALYSIS, SEE:
AND,
https://seekingalpha.com/author/kevin-wilbur/instablog/full_index
________________________________________________________
Click on the links below for direct access to the following:
OUR RECORD:
www.echovectorvest.com/OUR RECORD
OUR RESEARCH:
www.echovectorvest.com/OUR RESEARCH
OUR CURRENT FOCI:
www.echovectorvest.com/OUR CURRENT FOCUS INSTRUMENTS
TRADEMARK MODEL ONTOLOGY AND TERMINOLOGY MATRIX:
www.echovectorvest.com/THE ECHOVECTORVEST MDPP TRADEMARK TERMINOLOGY MATRIX
ACTIVE ADVANCED POSITION MANAGEMENT TECHNOLOGY:
www.echovectorvest.blogspot.com/PROTECTVEST AND ADVANCEVEST BY ECHOVECTORVEST MDPP ADVANCED ACTIVE POSITION MANAGEMENT TECHNOLOGY:THE ON/OFF/THROUGH VECTOR TARGET APPLICATION PRICE SWITCH
EXHIBIT WEEK RESULTS:
www.echovectorvest.blogspot.com/ADVANCED MANAGEMENT EXHIBIT WEEK RESULTS FOR THE GLD ETF AND THE DIA ETF
HIGH FREQUENCY TRADING DEMONSTRATION:
www.echovectorvest.blogspot.com/ECHOVECTORVEST MDPP HIGH FREQUENCY TRADING DEMONSTRATION AND POSITION TERMINOLOGY
DIAMOND OF SUCCESS:
www.echovectorvest.com/THE DIA ETF: THE DIAMOND OF SUCCESS
GOLD METALS:
www.echovectorvest.com/THE GLD ETF AND GOLD METALS
LIGHT SWEET CRUDE OIL:
www.echovectorvest.com/THE USO AND LIGHT SWEET CRUDE OIL
BIO, FOUNDER:
www.echovectorvest.com/BIO, PRESIDENT AND FOUNDER
Posted by EchoVectorVEST
________________________________________________________
What is ECHOVECTORVEST MDPP?
________________________________________________________
DISCLAIMER
This post is for information purposes only.
There are risks involved with investing including loss of principal. PROTECTVEST AND ADVANCEVEST BY ECHOVECTORVEST MDPP makes no explicit or implicit guarantee with respect to performance or the outcome of any investment or projections presented or discussed by PROTECTVEST AND ADVANCEVEST BY ECHOVECTORVEST MDPP.
There is no guarantee that the goals of the strategies discussed by PROTECTVEST AND ADVANCEVEST BY ECHOVECTORVEST MDPP will be achieved.
NO content published by us on the Site, our Blog, and any Social Media we engage in constitutes a recommendation that any particular investment strategy, security, portfolio of securities, or transaction is suitable for any specific person. Further understand that none of our bloggers, information providers, App providers, or their affiliates are advising you personally concerning the nature, potential, value or suitability of any particular security, portfolio of securities, transaction, investment strategy or other matter.
Again, this post is for information purposes only.
Before making any investment decisions we recommend you first consult with you personal financial advisor.
PROTECTVEST AND ADVANCEVEST BY ECHOVECTORVEST MDPP
"We're keeping watch for you."
TAGS: Stock Market Education, ETF Analysis, Major Market Composite Index, Market Outlook, Market Analysis, Technical Analysis, Cyclical Analysis, Price Analysis, Economy, Macro Outlook, Trading, Day Trading, Swing Trading, Investing, Dow Futures, S&P Futures, Stock Market Education, Market Forecast, Market Opinion and Analysis, EchovectorVEST, Portfolio Insurance, Portfolio Management
Simple template. Powered by Blogger.
RELATED LINKS

MEMBER
Themes: Stock Market Education, Financials, Futures, Federal Reserve,Portfolio, Market Currents, ETFs, Macro View, Alerts, Market Outlook,Economy, ETF Long and Short Ideas, ETF Analysis, Long Ideas,Commodities, EchoVectorVEST, Technical Analysis Stocks: SH, SSO,SDS, QQQ, PSQ, QLD, QID, IWM, RWM, UWM, UKK, TWM, DIA, DOG,DDM, DXD, TLT, TLH, IEF, UUP, UDN, GLD, GTU, DGZ, UGL, DZZ, GLL,IAU, SGOL, SLV, DBS, AGQ, ZSL, CU, PALL, PPLT
- EchoVectorVEST MDPP at Twitter
- EchoVectorVEST MDPP at Our Record
- EchoVectorVEST MDPP at SeekingAlpha/Instablogs
- EchoVectorVEST MDPP at SeekingAlpha/Articles
- EchoVectorVEST MDPP at LinkedIn
- EchoVectorVEST MDPP at Yahoo/Contributor
- What Is EchoVectorVEST MDPP?
- Back To Kevin Wilbur's Instablog HomePage »
Instablogs are blogs which are instantly set up and networked within the Seeking Alpha community. Instablog posts are not selected, edited or screened by Seeking Alpha editors, in contrast to contributors' articles.
- Share this Instablog
0