Market Moving News (Summary of 17 Articles)
Spending is a little soft. Retail sales were flat in July, following a 0.2 percent gain the month before (originally up 0.2 percent). The weekly reports were mixed. This data was a sharp contrast to E-commerce sales, which rose 4.9 percent in the second quarter vs. first quarter and vs. a gain of 3.3 percent in the prior quarterly comparison. Year-on-year, e-commerce sales were up 15.7 percent vs 15.5 percent in the first quarter. As a percentage of total retail sales, e-commerce continued its climb, to 6.4 percent vs 6.2 percent in the first quarter. [The E-commerce number could be distorting total retail numbers, if the sector's growth is not accounted for.]
Manufacturing continues to be strong. Acceleration in the New York manufacturing sector has slowed this month but remains very solid, at 14.69 vs 25.60 in July. New orders are still strong, at 14.14 vs 18.77, while shipments actually accelerated slightly, to a very strong 24.59 from 23.64. Industrial production increased a robust 0.4 percent in July, equaling the revised June pace (originally up 0.2 percent). Expectations were for a 0.3 percent boost for July. The overall capacity utilization rate in July firmed to 79.2 from June's 79.1 percent.
Inventories rose slightly and inflation is benign. Business inventories rose 0.4 percent in June, while sales rose 0.3 percent; this is a minor mismatch. Cross-border inflationary pressures are muted and won't be raising any red flags at the Federal Reserve. Import prices fell 0.2 percent in July and are unchanged when excluding petroleum. Year-on-year rates are also muted, up 0.8 percent overall and, when excluding petroleum, up only 0.7 percent. The export side is also soft, unchanged in the month. The year-on-year rate is 0.4 percent. . The PPI for total final demand slowed to a 0.1 percent gain after rebounding 0.4 percent in June.
Housing remains weak. Demand for mortgage home purchase applications remained flat in the August 8 week, down 1.0 percent for the second straight week. Year-on-year, purchase applications are down 10.0 percent. Demand for refinancing is also weak, down 4.0 percent in the week. The declines come despite a dip in mortgage rates where the average 30-year mortgage rate for conforming loans ($417,500 or lower) fell 2 basis points to 4.24 percent.
A rise in the hires rate suggests moderate improvement in the labor market. This is a plus along with the higher job openings rate. There were 4.671 million job openings on the last business day of June, up slightly from 4.577 million in May, the U.S. Bureau of Labor Statistics reported today. The hires rate (3.5 percent) was little changed and the separations rate (3.3 percent) was unchanged in June.
Initial claims rose 21,000 in the August 9 week to 311. The 4-week average rose 2,000 to 295,750, which is 15,000 below last month's number. Continuing claims rose 25,000 in the August 2 week to 2.544 million; the 4-week average moved up 9,000 to 2.528 million, which is 30,000 lower than last month's number.
Sentiment
Sentiment metrics are improving. The July small business index increased 0.7 to 95.7 for July. August inflation expectations were 2.0 percent, up from 1.9 percent. The Bloomberg Consumer Comfort Index rose for the first time in three weeks, to 36.8 in the period ended Aug. 10. The gain was led by improving views on household finances and the economy. Sentiment strengthened among high- and low- income earners last week, while middle-income groups were less optimistic. Sentiment among full-time workers improved to a seven-week high.
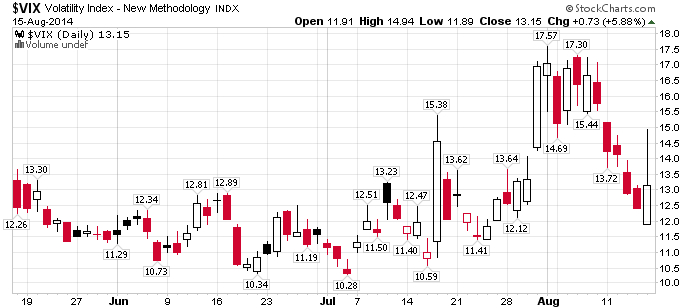
The VIX indicated a lot of relief with the rally, followed by a short panic over the rumors of Ukrainian fire on Russian armor that had crossed the border.
The Market (S&P 500)
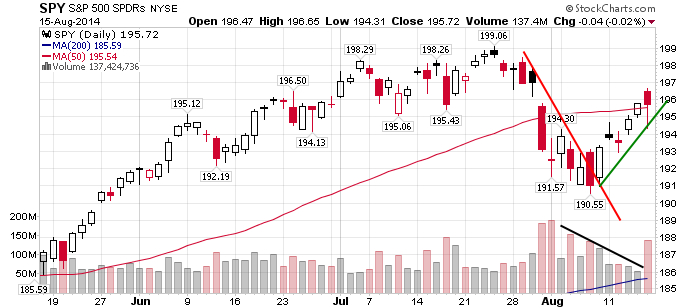
The S&P 500 executed a V-shaped recovery during the last 6 days; however Friday's action had a volatility spike driven by the report of a Russian incursion into Ukraine. The market partially recovered, however many traders, including myself, likely held back on buying in the event of further action over the weekend. Note resistance at 198 and 199, and support at 191. Volume and volatility subsided during the uptrend except for Friday.
A V-pattern is a weak reversal. Institutional traders did not have time to establish bullish positions, which is why the volume was low until Friday. Price action is from trades by short-term players, who are likely to flee at the earliest sign of adversity-such as the Ukrainian news on Friday, which was an unconfirmed report with scant information.
Small Caps (IWM)
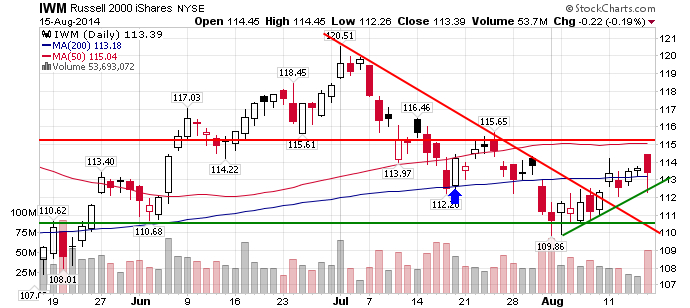
In contrast to the S&P 500, Small caps built a base during the prior week, and climbed out of it last week. IWM is showing more positive sentiment and is moving with the rest of the market, although not as fast as the QQQ's (not shown). Note the resistance at 115.
Core Sectors
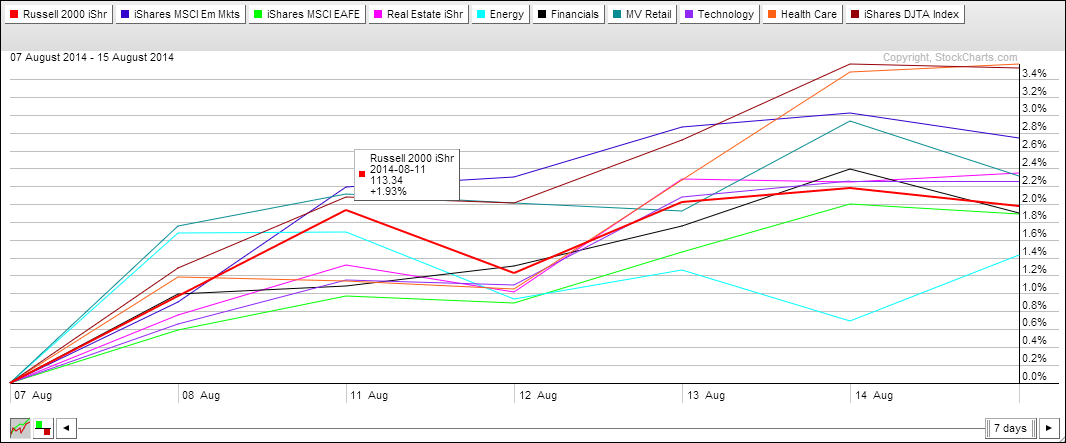
The new trend is shown over seven days. The small caps (IWM) are increasing in relative strength. There is leadership in transportation (IYT), healthcare (XLV), and emerging markets (EEM). Real estate (IYR) is steadily gaining.
Best Relative Strength
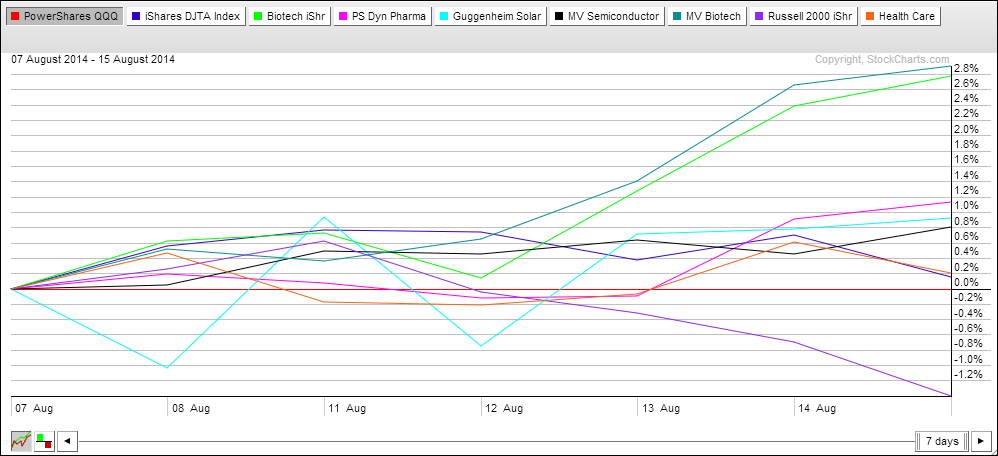
The chart above compares the 36 ETF's I follow to QQQ, which was stronger last week than IWM. Standouts include biotech (IBB, BBH), pharma (PJP), solar (TAN), and semiconductors (SMH). I always like a position in healthcare (XLV), which mixes providers and pharmaceuticals, because it tends to have less-volatile long term trends.
Trades Last Week
Sold: TAN
Bought and Sold: AAPL, IWM, BBH, FCEL, IAI, IGV, ILMN, LMT, SMH, SOCL, SSO, XLV
Holding: AGNC
During the week's strong rally, I loaded up on a variety of stocks and ETF's. On Friday, I was on line when the Ukraine rumor broke and moved up stops, reasoning that even if the market recovers, being exposed over the weekend was undesirable. The strong moves earlier made the week profitable. The only stock remaining in the portfolio is the mREIT AGNC.
Conclusion and Action
The data suggests that the U.S. economy is strong and getting stronger, and the market is being held back by the Ukraine threat, which is real because of its potential to tank Europe's economy. Consequently, I am keeping a close leash on my holdings.
Next week, I will watch for setup patterns, wait for a breakout in a strong market, hoping that the initial move builds sufficient profit to continue holding overnight and the next several days. A fade after the initial breakout, will trigger stops, keeping losses small in the event the market rolls over.
The following ETF's are buy candidates: QQQ, IWM, SSO, XLV, IYT, IBB, BBH, PJP, TAN, SMH, and SOCL (volatile). Most of these are volatile, so the holding periods may be short. When the S&P 500 is strong, SSO, at 2x the index does quite well.
Have a great week!
Disclosure: The author is long AGNC.