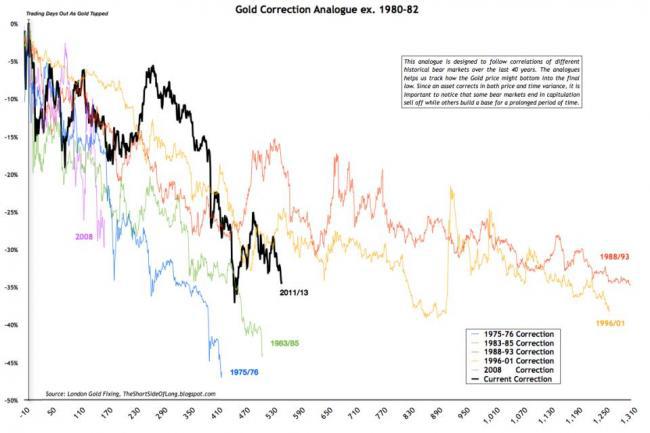
Kevin Davitt of RCM Asset Management posted an article today that contained the above chart, click here to read the article. The chart shows some previous bear markets in gold that have lasted as long as the current one that has gone on since the Sept. 2011 top above $1900. What I find interesting is that the 38% correction that we hit a few months ago when gold bottomed just above $1180, is a substantial correction that has been longer than all but two corrections in the last 40 years. Both of those longer corrections lasted 5 years. But once they corrected over 35%, they had several bounces off the lows, some of which were substantial. Even if we should make marginal new lows in the very near future, looking at the 1988/1993 and 1996/2001 corrections, we should get a substantial rally in gold within the next 3 months or so. Also, the two long corrections never exceeded more than 40%. This makes me believe that $1180 support will hold as it represents a 38% correction, but if the support gives way, support at $1140 should not be violated as we would be at a 40% correction level at that point. I believe that the talk of $1100 or $1000 is not justified under any circumstances for a multitude of reasons. Most importantly, $1200 is below the cost of production of a majority of the major miners. Also, the cash gold market should really heat up with aggressive buying in Asia and India, should gold trade below $1200. When India raised tariffs and limited the amount of gold that could officially be purchased, they merely created an incentive to have gold smuggled into the country and truth be known, purchases are probably higher than they have ever been. China supposedly overtook India this year as the world's largest consumer of gold, but that only accounts for the official India imports. China had a good manufacturing report released Sunday night which means the economy there is doing just fine and can continue to provide support to gold through physical purchases which have exceeded 100 million metric tons for the past several months. These purchases cannot be ignored forever!
I saw another article that I wanted to mention, where the writer calls the current action in gold miners (think GDX), an inverse bubble where the price cave-in is not realistic and has become frothy with so many shorts. Unfortunately I cannot find the article now but will continue to look for it. The shorts are doing quite well right now, but the lower we fall, the greater the rebound when the bullish bubble ultimately replaces the current bearish gold bubble.
Many traders/investors have asked me if they should panic and leave now. With the extreme bearish action that so easily took out the support at $21.52 in GDX established last week, I don't blame anyone who decides to give up on the miners. Also, anytime one is panicky or one cannot sleep, never hurts to sell out 50% to raise capital to buy back lower at some future date. It is everyone's own choice as to what they want to do. But for me, I will be waiting it out, holding onto GDX/NUGT/NEM in anticipation of better prices to sell in the near future. I am not only holding the unleveraged positions, but the leveraged NUGT too, based on the following weekly chart of NUGT.
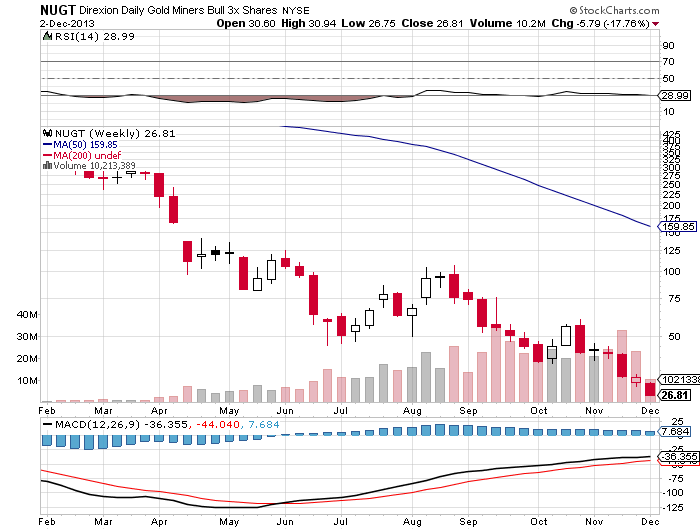
In April 2013, NUGT stopped dropping at $96.10, bounced back to $142 the following week, then worked lower to $81.30 just 4 weeks later, bounced back in a couple weeks to $124.20 to let the traders who bought in the $96s and the $81s both make money.
But what happened next is quite remarkable. Suppose someone bought when NUGT retraced back to the $81 support area in the middle of June. The support gave way, and a couple weeks lower, a low of $45.50 was realized. In 4 weeks, NUGT rallied back to $85.70, allowing anyone who bought at $81 to get out at a profit. Then after a selloff in two weeks to $50.30, NUGT rallied quickly to $103.90 in a week, and hit $106 two weeks later. What is remarkable is that NUGT could fall from $124.20, straight down to $45.50 and then rebound to $85.70 and $106. Comparing all this to the recent high of $59.87, to fall similar percentages, we could go from $59.87 high to a low of $21.93 (drop of 63.36%). From the low of $21.93, NUGT should rally 88.3% to $41.29. Then work on up to $50.07 and $51.09.
Here is another thing to consider. When a trader buys at a support level that is broken, a future rally still lets the trader out. For instance, had one bought NUGT at the $96 support and a new low was made down to $81, a rally to $124 bailed out the trader who was holding long from $96, the previous low. NUGT rallied 29% above the $96 purchase price. Then when $81 and $45.50 were the last two lows, anyone holding from $81 could get out at $85.70 and again at $103.90 and $106. The $106 price is 30.9% above the $81 price. Then when $45.50 and $37.83 were the last two lows, the rally to $59.87 bailed out anyone long from $45.50. The price of $59.87 is 31.6% above the $45.50 price. So now if we should fall to $21.93 having broken the support at $37.83, anyone long from $37.83, should get out on a move between 29% and 31.6% above the $37.83 price, which works out to a rally back to $48.80 to $49.78. Anyone long NUGT in the $41 area would appear to have a good deal of breathing room, if history continues to repeat. The percentage move above the previous low keeps rising slightly so the next kickback from wherever we bottom, should be 33% above the previous low of $37.83 which computes to a rally to $50.31. One never knows where the current low is going to be, but the previous low is always known. And NUGT for three previous cycles has rallied 29%, 30.9% and 31.6% from the previous low. We know the previous low was $37.83, so one can expect a rally back towards $50 in NUGT, based on these calculations, without having to know the exact bottom of the current downturn. I hope this is helpful.
Disclosure: I am long NUGT.
Additional disclosure: Also long NEM & GDX