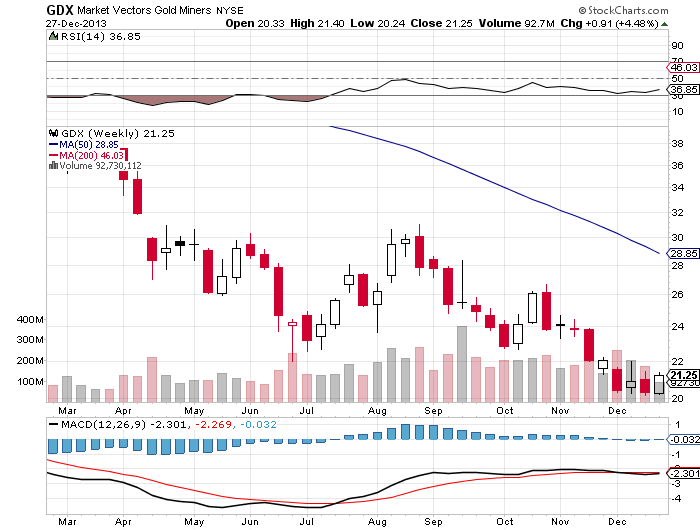
In the very short term, we are likely heading higher. Above is a weekly chart of the gold mining ETF (GDX). A couple weeks ago, I wrote an instablog article explaining how we scored a bullish Harami pattern that projected higher prices, click here. Instead of rallying, we did a bearish engulfing pattern, going back down to the lows. After making the most minimal marginal new low, this past week we now completed a bullish engulfing pattern on the weekly charts. This negates the bearishness of the previous week and puts us back onto a path of strength for the next 2 to 6 weeks.
For the past four weeks, GDX has valiantly defended the $20 support level and should continue to do so until we rally to the $25 to $26 level or a bit higher on short covering. Lower prices have been rejected and it is a matter of time before some unknown bullish catalyst catapults the miners to higher prices. A move of 20% higher in GDX would be a 60% rally in NUGT and take us from the high $20s to the low $40s.
Gold Should Begin Rallying Higher By The Middle of February 2014, With Much Stronger Prices the Second Half Of The Year
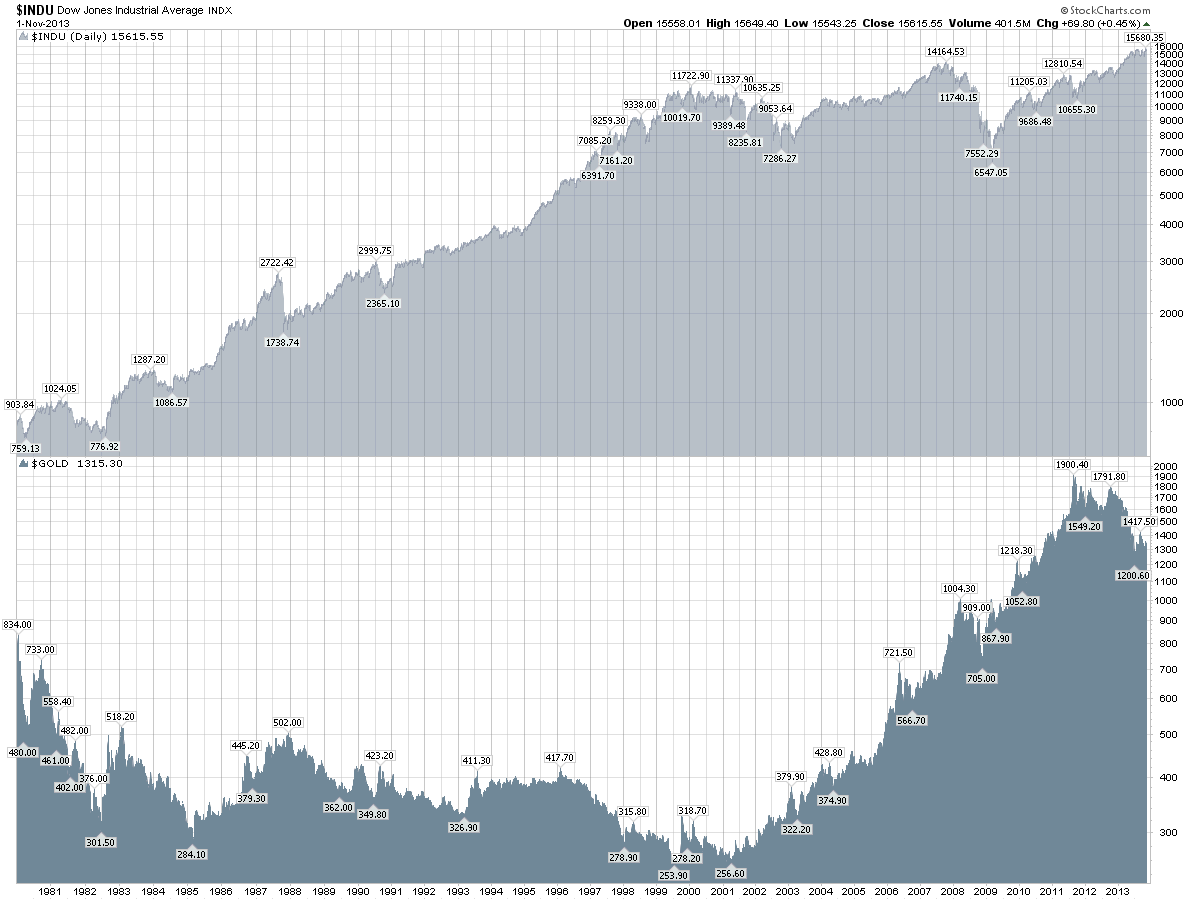
The above chart has the Dow Jones chart on the top and gold on the bottom, going back to 1980. Gold made the big parabolic rise in 1979 and topped out in January 1980, at the very beginning of the chart above. Gold fell from the January 1980 peak of $834, to a low in June 1982 of $301.50. That was a 2 year and 5 month bear market. More recently we have topped out again in September 2011. During the more recent topping action, we never experienced a parabolic rise into the $1900 summit. Most technicians believe that a parabolic rise above $2500 is still in gold's future. At the very end of the decade long bull market in gold, one should not top out for good without having a blow-off parabolic rise at the end, just like we experienced in 1979. Surely that parabolic rise in still in our future so the $1900 level is surely not the ultimate high that we should see in the next few years.
Anyway, if the current bear market lasts an equal 2 years and 5 months like the 1980 to 1982 bear market, it would project a bottom in February 2014. The bottom could come a bit earlier or later than February 2014, but it shows how we are in the 9th inning of the current bear market and the bearishness should soon end. It is not surprising then to find others such as Hebba Investments, calling for a bottom in January 2014. If you did not catch the article, click here. I pretty well agree with all the points made in the Hebba Investments article. The only difference is that I am hopeful the recent low of $1188 in gold will hold and then the June 2013 low of $1180 would turn out to ultimately be the bottom of the bear market.
Again, if we should make a new low in gold, I feel quite strongly that the very worst case scenario is a bottom at $1155. I say that because after a bear market goes on for 550 trading days or longer, it never makes a new low by more than 2% based on past experience, as I explained in a past article, click here.
Brokerage Firms See Gold Basing In The $1155 to $1250 Range In 2014
For a table to see where gold prices are predicted for 2014, click here. Most analysts are predicting a 2014 gold price in the $1150 to $1250 range. Only Goldman Sachs is low at below $1000 in the near term and $1144 for the year. GS predicts an end of year price of gold of only $1050. But Goldman Sachs is heavily long the ETF (GLD) and will surely flip to the bullish side as soon as they accumulate enough shares.
Based on past bear markets and various long term cycles, any weakness in the first half of 2014, should be corrected with higher prices in the second half of 2014. I am looking for $1450 as the minimum end of 2014 gold price and am hopeful we could end the year as high as $1650.
Where Gold Is Likely To Trade In The Next Few Years
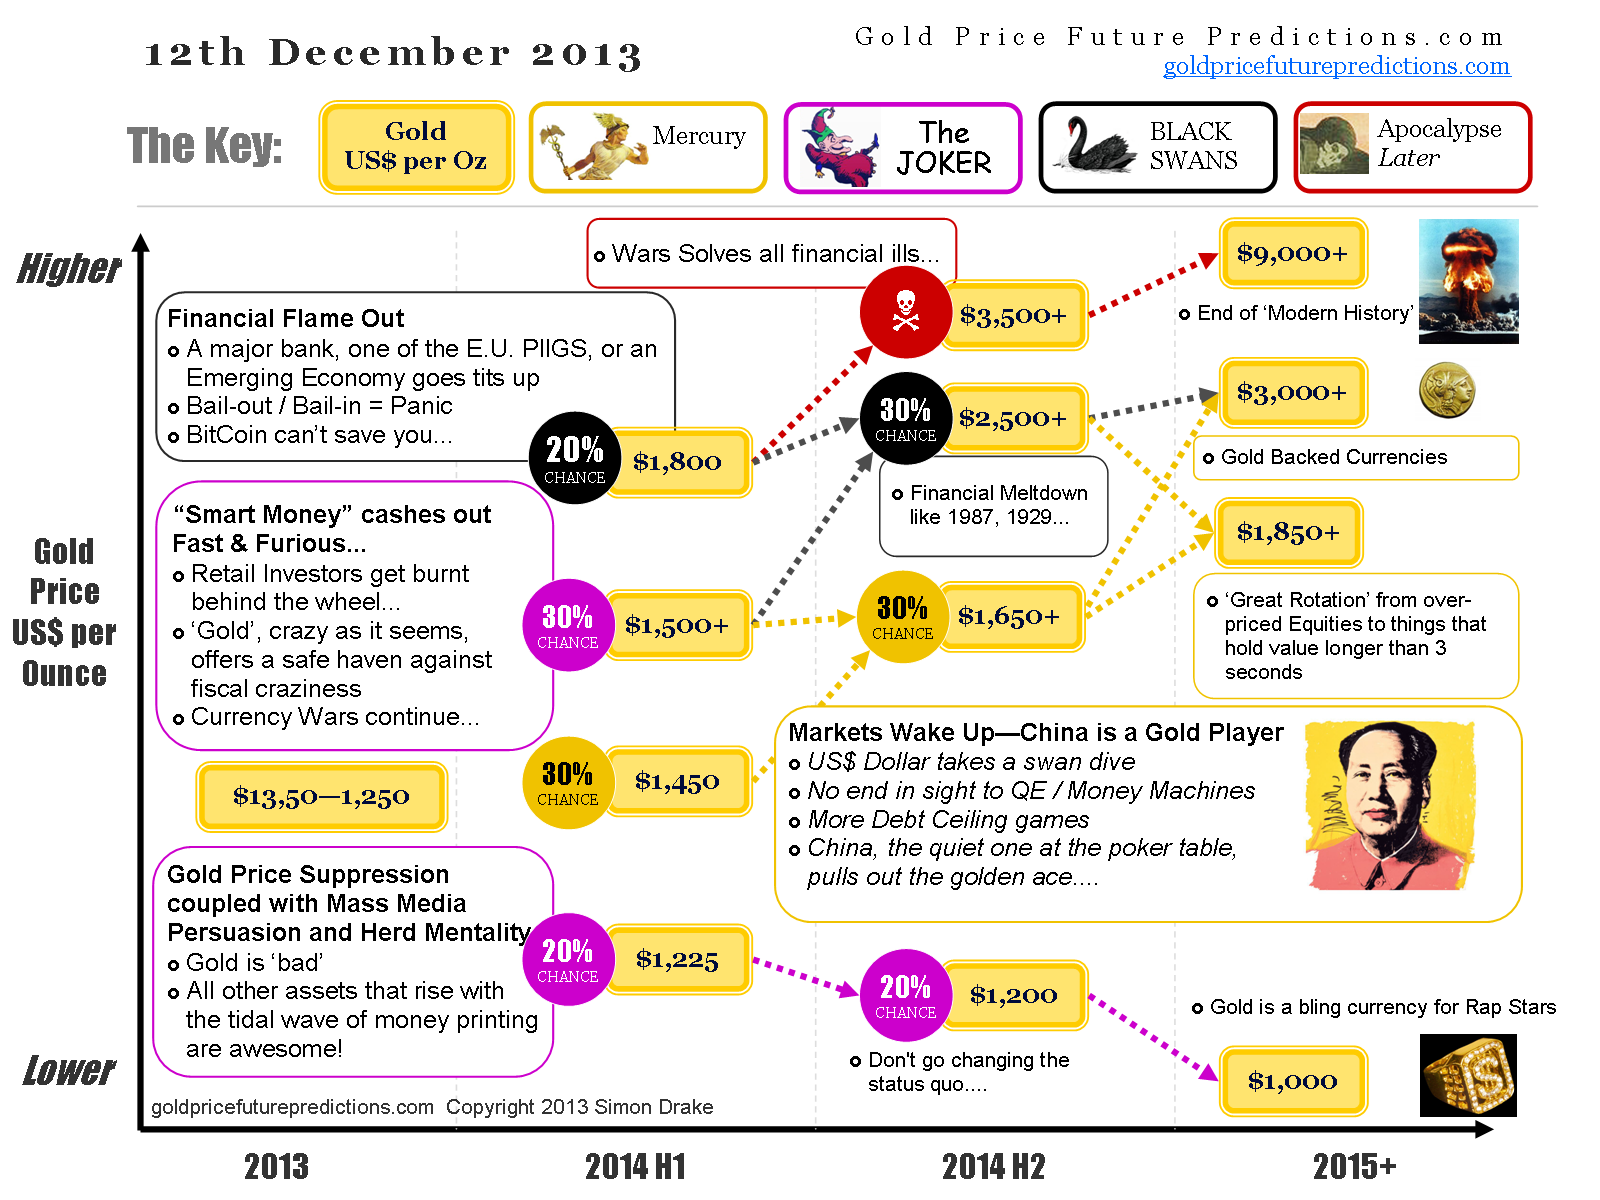
The above chart is from an article by Simon Drake, you can read here. He sees the worst case scenario of 2014 gold prices averaging $1200. I agree.
Disclosure: I am long GDX.
Additional disclosure: Also long NUGT & NEM