I have noted many times in past commentary about the multiple Dow Theory buy signals that took place last year .. Last week I mentioned the one lagging index that was troubling to me, the DJIA 30 . As of this week with all of the volatility and price weakness we still do not have a Dow theory "confirmation" of the new high that was put in by the Dow transports last week.
However, it should NOT be construed as a Dow Theory Sell signal . For the record ,to get a Dow Theory "sell signal" would require the DJIA 30 to close below its June 2012 low of 14659.56 with a close by the Transports below their respective June 2012 low of 6173.86. We're not close to those levels and as such there is no need to be concerned with this non-confirmation, other than a flashing yellow light of caution. For the short term its now about emerging market currencies , the contagion and systemic risk words are being rolled out again. Throw in "tapering" and oh my , everyone is showing charts of 1929 !!! what shall we do ? The negative naybobs are now saying "you see I was right" .
Lets stop right there and recap - they have been wrong for a very long time to the tune of a 180% increase in the equity market , the last 28% taking place last year. So now with a sniff of a correction in the air they are out in droves.. Nonsense... This week's GDP report underscores the mistakes of those who have predicted recessions and equity market/economic collapse all along the way to where we are right now.. .
That aside, there was a lot of technical damage done with the recent selling phase. Friday's (Jan 24) 300 point Dow plunge was also a 90% down volume day....adding to the "technical" damage.. Earlier support around 1810 or so will now be resistance if there is a any rally attempt.. Be aware that the "mindset" of investors has changed for the moment , as any negatives are highlighted, and positives pushed aside. That is Normal when the market enters into a corrective phase.. Many will look around and say the economy is improved , things look better, why is the market going down? It's all about investor psychology & sentiment , don't lose sight of that emotional aspect of the markets..That is key to long term success..
My commentary from last week "The S & P sell off blew right thru the first line of support around the 1813 - 1815 area , and the swiftness of that move can't be ignored.. Right now , I'm looking at the 1760-1770 level on the S & P as the next line of support" .... Having said that I added the chart below to show where we are today ...
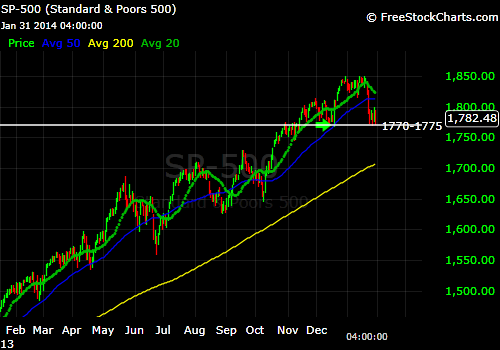
The green arrow indicates the area I targeted for support (The Dec. '13 lows). The "line in the sand" sits right around the 1770 -1775 area on the S & P, and so far it has held.. To further confuse the technical picture,, the Dow 30 has violated their Dec lows , while the Russell 2000 and the Dow Transports have not.... A mixed signal at best..
Long term investors need to keep their eye on the one result that matters - EARNINGS.... all else is "noise" , at the end of the day when the emerging market currency issues get resolved and the "fear" subsides , the market will then look at what's important..
Getting back to earnings -- the "beat" rate jumped as high as 70% before falling back down to 58% on January 15th. Since then we've seen it stabilize and solid beat rates late in the week of the 17th have taken us to a range around 65% since the Martin Luther King Day long weekend. As of Wed. 1/29, 66% of firms reporting have beaten their consensus EPS estimates, which is better than the last two fourth quarter reporting periods (61% in 2012 and 60% in 2011). Since the start of the current bull market in early 2009, the average quarter has had a beat rate of 62%. If the current quarter continues at this pace, we will log the highest EPS beat rate since this reporting period in 2010. But keep in mind that less than 300 names have reported. With over 80% of the market waiting in the wings, this earnings season is far from over.
These are important stats that are being ignored because of the global "headlines" . Eventually the market always gets back to what really matters . And don't forget the dividend increases that are still being announced along with share buyback programs. The latest two that I noticed this past week. (DOW) & (PX)
One statistic that you will rarely hear about is "truck tonnage" and its correlation to the S & P as a proxy for how the economy is doing is one that I have used for quite some time.. According to the American Trucking Association, U.S. trucks carried 8.2% more freight tonnage last December than they did a year ago. That's pretty impressive, since we haven't seen strong gains like that on a sustained basis since 1997-98.
Add the GDP data reported on Thursday, (that contained a very good consumer spending number, that many overlooked ) combined with no "headlines" on our emerging market friends and we had the makings of a nice comeback Thursday, that held support (marginally) at my pivot points illustrated in the chart above. More currency concerns on Friday before the open as I heard it was now European issues that made headlines, and the S & P sold off again, but held the support line.
So with that type of "mindset" in the air, and the fear mongers (AKA those that have had the market wrong ) sounding the alarms, I don't think we are "out of the woods" just yet... Every headline is met with a move of 10 points on the S & P and that type of whipwsaw action makes it difficult to gauge the market.
The headline risks are still there as indicated, but the fundamental backdrop has been good. So it's possible more of a sideways trading range maybe setting up for the short term..... as each "side" has their influence on the markets. However, a break below that support line and we could easily see a free fall to new lows.. So that fact shouldn't be ignored.. We have seen this type of sentiment before with the selloffs due to other "fear" based issues, so they shouldn't be underestimated. But as we all know they all turned out Ok, creating opportunities ----and so I note : this too shall pass...
Finally, (assuming you are not a trader) ask yourself the question, will the emerging market issues derail the U.S. and global economy and trump the improvements we have see so far ?.. I have answered that for myself and the answer is -- No.. Given that backdrop, I have a shopping list ready and will remain flexible watching what the market is telling me and cautiously pick my spots..
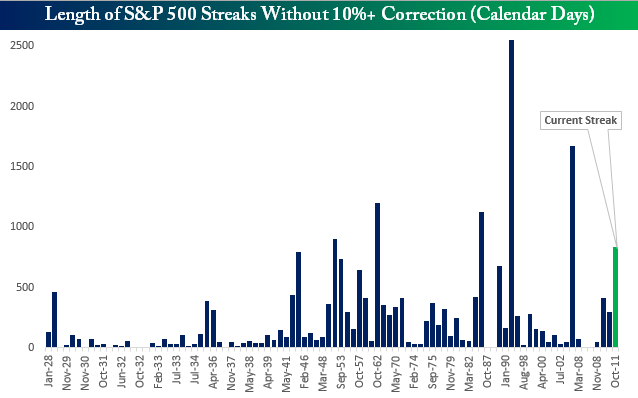
Finally a chart from Bespoke Group indicating the S & P and its current streak without a 10% correction .
In the context of "Keeping it real" -- the S & P is now down 3.5% from its all time highs...!!! Keep it real & in perspective .. I saw a chart posted on CNBC & the internet on Friday, indicating that we are in the same market pattern as 1929 !! (Of course it was a guy who has been a bear since 2011) ... Enuff said !
The "Walking Dead" aka "doomers" are all around us again...
Stay the course ,
Best of Luck to all...