I'm severely chopping stuff here to try and get the size down to something that causes fewer problems when I update. In that vein, links to blogs older than the 01/01/2014 version, PIPE discussions, one year charts will be found only in that and older ones. I've chopped some of the mostly historical short sales related stuff which has minimal utility and will keep it much smaller going forward.
Here's hoping this all helps and is still useful.
In the below chart the volume is inverted to enhance readability! Be aware when you view it!
(right-click and open in new tab, position cursor over image to be able to zoom and scroll)
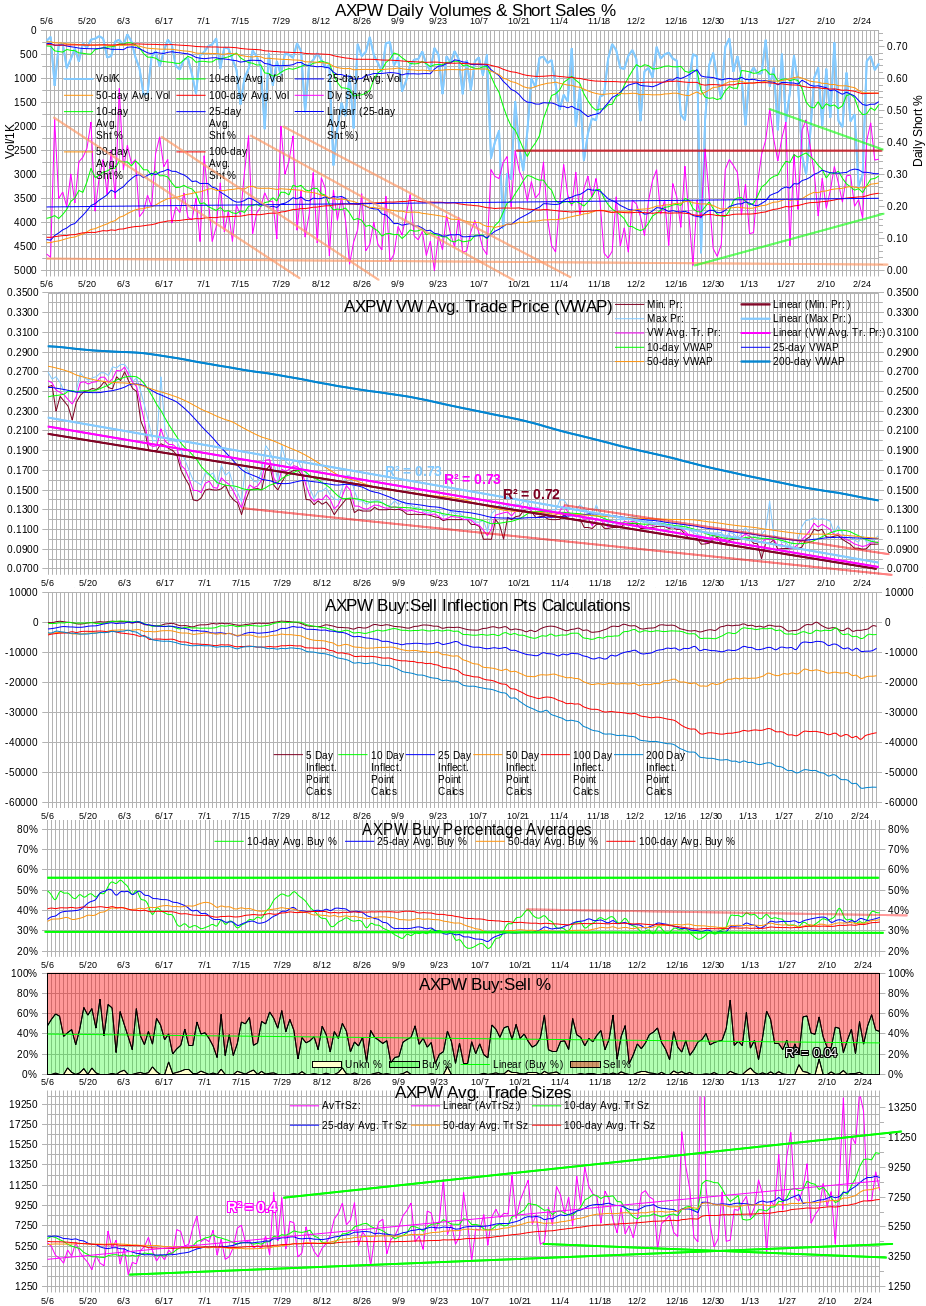
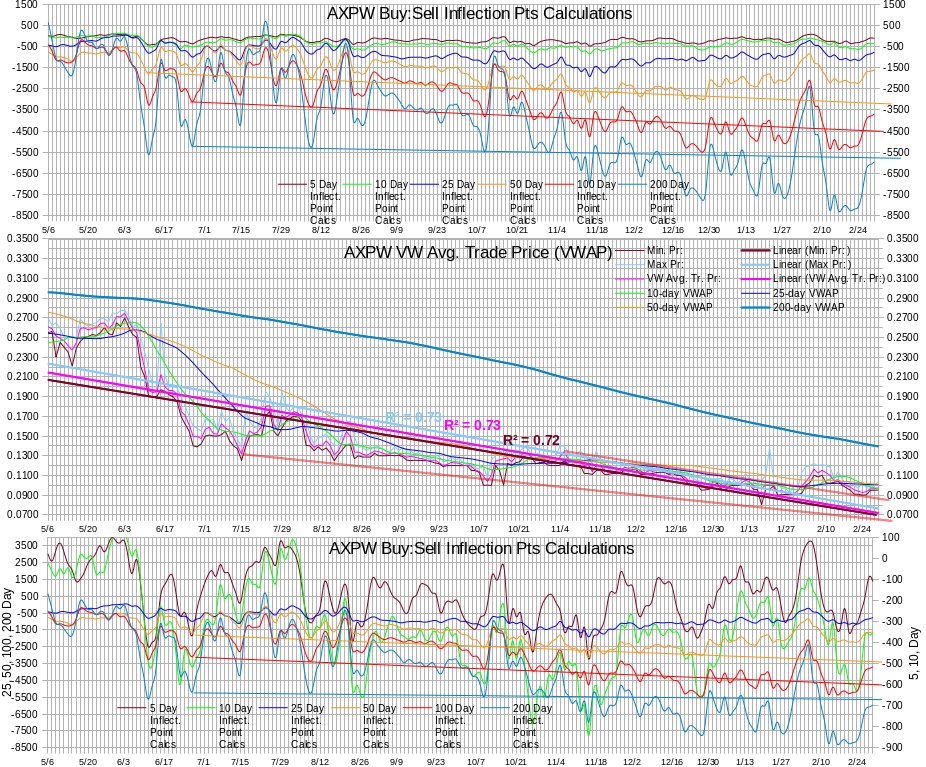
The following are modified inflection point calculations bracketing a price chart for comparison. Note that the false bullish moves and contrary moves of the 5-day has been eliminated.
The two identically calculated inflection points are calculated differently from the original above. I have two different presentations of this newer version. The top one has all periods on the same scale. The bottom one has longer periods on the left scale and shorter periods on the right scale. The hope is that shorter period changes will be easier to spot. More work to do, this is a start, hopefully.
I've identified some changes I want to try on the new inflection point calculations but haven't had time to implement them yet. I'll work them in over time after a little experimentation.
Comments and further suggestions welcome.
(right-click and open in new tab, position cursor over image to be able to zoom and scroll)
Older stuff for "2013 Dly Sht % of 'sells' values", Weekly 85% price summaries going back to 6/14/2012, and some day-to-day VWAP changes stuff going back to 10/09 are available in AXPW: Intra-Day Trade & Buy:Sell Inflection Point Charting Beginning 10/1/2013.
"Dly Sht % of 'sells'", inflection point calculation values, and end-of-week 80% (was 85%) PIPE price factors are now only in the latest daily comment.
The PIPE agreement was amended, changing the 85% calculation to 80%, among other minor things. See AXION POWER INTERNATIONAL, INC., FORM 8-K, Filed 01/03/14 for the Period Ending 01/02/14.
02/28/2014: EOD stuff partially copied to the concentrator.
# Trds: 64, MinTrSz: 400, MaxTrSz: 40900, Vol: 687500, AvTrSz: 10742
Min. Pr: 0.0952, Max Pr: 0.1039, VW Avg. Tr. Pr: 0.0974
# Buys, Shares: 31 292030, VW Avg Buy Pr: 0.0984
# Sells, Shares: 33 395470, VW Avg Sell Pr: 0.0967
# Unkn, Shares: 0 0, VW Avg Unk. Pr: 0.0000
Buy:Sell 1:1.35 (42.48% "buys"), DlyShts 239630 (34.86%), Dly Sht % of 'sells' 60.59%
In aggregate, my optimism that we won't see $0.08xx again, at least near-term, got a BIG BOOST today, mostly due to my thoughts on the well-executed market movement over this week, which are discussed much later. What happens while or after the PIPErs take their profits is not something I will guess at yet.
Parsoon's out or not, ARCA being much more well-behaved as VWAP rises on falling volume, share issue price next week of $0.0766, if I'm correct, ... The PIPErs are set to reap 21% to 27% profit next week. They have skillfully set the market for this IMO. Thinking on that in my blog.
The average of the lowest 20 VWAPs times 80% today is 02/27: 20 lowest intra-day VWAPs in 40 days avg, $0.0766 vs. $0.0767, $0.0768, $0.0768, $0.0769, $0.0772, $0.0775, $0.0777, $0.0778 and $0.0779 on prior days. 80% of today's VWAP is $0.0779 vs. $0.0773, $0.0770, $0.0749, $0.0742, $0.0752, $0.0763, $0.0785, $0.0799 and $0.0816 on prior days. These are potential prices for the next tranche of shares to the PIPErs.
Today's low, high, VWAP, trade volume, and daily short sales moved 0.21%, 3.90%, 0.82%, -15.86% and -15.07% respectively. Price spread today was 9.14% vs. 5.26%, 7.86%, 15.44%, 6.59%, 9.23%, 8.42%, 3.59%, 6.40% and 9.52% on prior days.
Without the one $0.1039 trade discussed below, using $0.10 as the high, we would've had the days high movement and price spread of 0.00% and 5.04% instead of the 3.90% and 9.14% we got. I'll be using $0.10 as the high in my comments below.
On the traditional TA front, we had (again, ignoring the $0.1039 trade) a reasonable spread, a higher low (+$0.0002 - I'm wowed!) and close, a flat high, and volume in a range that I think is reasonable.
In contrast to yesterday when most of the oscillators I watch were not able to maintain the prior small positive moves, most improved and the others stayed essentially flat. Full stochastic continued to rise after leaving oversold three days ago and is near getting above neutral. Williams %R recovered and exited oversold again. RSI recovered from ~43.6 to ~46.9 in its quest to get above neutral, 50, and momentum moved from ~0.835 to ~0.91 in it's struggle to get above neutral of 1. Ditto for MFI and ADX related stuff - both had small improvements.
There's little change in the behavior of the MACD - it remains essentially flat and it's histogram is still climbing back up towards neutral.
Price (range) remained "stable" for the fourth day. A non-traditional factor, intra-day VWAP, has moved, Friday to Friday, +3.65% on the week with the high +7.11%, thanks to the $0.1039 trade, and the low is up +4.62%. If I use the high without the $0.1039 trade, $0.10, our high for the week is +3.09%.
In the interest of "fair and balanced", be aware that I am ignoring the changes since, e.g., Monday 2/7. It's been quite ugly, as one could expect.
Unfortunately we closed lower, at $0.0975, than our open of $0.099. This still gives a green candle on the charts because of the close Thursday at $0.0952. But the volume on a down day, Thursday (lower than Wednesday's $0.097 close) was higher volume than today's - ~817K vs. today's~688Kn - suggests weakness.
The newer short-term descending resistance I've been mentioning got it's first test yesterday and passed, indeed acting as resistance as price pushed above it briefly and then fell back to close well below it. Today we got a close above it with only an intra-day low penetrating it. That resistance is ~$0.096 today. In traditional TA terms, we now need a "confirmation" of a second close above it. With the stuff I discuss below regarding the $0.1039 action, I fully expect we'll get the confirmation.
Larger trades (>= 15K) occurred on 11 of 64 trades, 17.19%. These totaled 332,270 shares, 48.33% of days volume, and traded at a VWAP of $0.0977. 4 of these trades, 36.36%, were buys of 125,000 shares, 37.62% of the larger trades volume, and traded at a VWAP of $0.0995. 7 of the larger trades, 63.64%, were sells of 207,270 shares, 62.38% of the larger trades volume, and traded at a VWAP of $0.0966.
The rest of the trades, 365,230 shares representing 53.12% of day's volume, went at a VWAP of $0.0971.
ARCA was again on the bid pre-market at $0.095 and out early, by 09:32. Each day I see this very early exit I wonder if they aren't just putting in a "floor". Today when bid got to $0.097 they exited. Thursday, 2/27, pre-market at 08:40 they had a bid of $0.095 and exited the $0.095 bid, exposing a $0.0901 lined up lower, when CSTI entered a $0.095 bid 10 minutes later. At 09:50 when bid hit $0.097 ARCA was off the buy side entirely. The prior day they bid $0.0901 pre-market and were gone, again, by 09:32. Ditto for 2/24. They could be honest-to-goodness bottom-feeding bids I guess. But why exit from the $0.095 position when early action would suggest, especially if traditional "late-day weakness" might come into play, that there is a decent chance of filling the buy? This weakness is common enough that any serious bottom-feeder ought to hang in there I would think.
On the sell side ARCA was not as aggressive as seen in the past. I don't know if it was due to fewer and less aggressive challenges or a strategy/needs change. Only ATDF and BTIG challenged them today, and later in the day BTIG stopped doing so.
ARCA entered the sell side at 11:23 with a $0.098 offer, undercutting the best $0.0998 at the time, and stayed fixed right there until exit between 14:03 and 14:28. Strangely, ADVFN "trades" shows apparently canceled orders occurred between 14:20 and 14:27, to the tune of 20K shares. I don't know if there's any relation, but I've seen canceled orders evidenced before. Unfortunately I wasn't looking to see if there was correlation with ARCA in any way so I'll leave my TFH alone here.
Anyway, ARCA returned 10 minutes later at 14:38 with a $0.097 offer and had moved back to $0.098 by 14:40, followed by a $0.0975 in the same minute to counter a transgression attempt by an ATDF offer of $0.0979 (big surprise on a 1/100th penny move, huh?). By 14:52 all was right with the PIPEr world again as ATDF had slunk off to a $0.0999 offer and ARCA reclaimed the throne with a $0.098 offer again.
Thanks to late-day strength (see the breakdown by time starting with the 14:40 period), ARCA was offering at $0.099 by 15:21. They exited around 15:34.
On the buy side, early action was weakening with the bids dropping from as high as $0.097 at 09:32 to as low as $0.0951 at 10:44 as there was little competition to get shares. From that point onward, over time, competition increased as CSTI, then CDEL, then NITE, then ETRF all began showing interest and moved the bid as high as $0.097 at 14:27 and to $0.0975 at 15:19. During this interval we did see some ebb and flow with bids getting low again - down as low as $0.096 at 14:40 (around the canceled order time). But it started improving almost immediately.
In the non-traditional TA area, today's buy percentage, 42.5%, was again weaker than the prior 43.8% and 58.9%, and was accompanied by reducing volume. With VWAP increasing ($0.0927, $0.0936, $0.0962, $0.0966 and $0.0974) while volume trends lower (in thousands: 3,002.14, 632.77, 535.65, 817.14 and 687.50) we can deduce that the market moving higher is encouraging opportunistic (or defensive?) selling much more strongly than buying pressure.
The reduced aggressive nature of ARCA has become a short-term normal for now. The prior days, which I characterized as a "tactical withdrawal" in preparation for the next assault, is still a fair assessment I think. The continued moderately aggressive behavior, such as seen again today, still seems to support the "tactical withdrawal" thought. Some of this may be due to the lessened competition from the other more active market makers. There's no way to know, but we do have observable phenomena that we can try to judge as time passes. I think next week, combined with the VWAP changes and $0.1039 extraordinary trades of this week may yield an assessment that we can make with some confidence.
Daily short percentage remains in a range I consider appropriate for the volume and buy percentage we see. I still can't judge the possibility that a change in daily short sales percentage behavior may be underway. I expect early clues to surface next week.
My original inflection point calculations' one-day changes are essentially flat today, except the 5-day which weakened a small amount. Aggregate change over five days reversed from showing all periods improving for the second day in a row to all periods weaker. Rates of change over those days moved from all improving to all weakening today. Volatility remains as no solid trend has been seen for quite some time.
The newer version, which had only one period in the one-day changes showing improvement, now has only the five-day period showing weakening while the others are essentially flat with very small degrees of improvement. The aggregate change over five days has moved from 5 weaker periods to all weaker periods. The rate of change over those five days, which have four periods showing improvement, has flopped back again to a three and tree split of weaker and improved. As with the original, volatility prevents appearance of a strong trend.
The following details my thoughts on factors that lead me to believe the PIPErs have moved the market to their benefit and to the detriment of those who thought this week might represent a turning point.
I could be wrong.
We again had an outlier single $0.1039 trade of 2,900 shares at 14:30:45 that moved the day's high well above (+3.90%) the next higher trades of the day with some volume, $0.10. What's really interesting is that ADVFN shows the bid/ask when the trade was made of $0.097/$0.10. This fits with my "snapshots" at 14:28, 14:30 and 14:35 of $0.0998, $0.10 and $0.0999. The only $0.1039 I saw during the day was a normal TEJS-provided one that gets placed in the morning and sits there all day. When it got taken it unmasked a $0.105 offer from TEJS.
Without the one $0.1039 trade, using $0.10 as the high, we would've had the days high movement and price spread of 0.00% and 5.04% instead of the 3.90% and 9.14% we got. This one trade certainly offered a rosier scenario to those who might rely solely on the charts for their entry and exit decisions. But it wasn't the first or only factor that might lead one astray.
When we had similar $0.1039 outlier trade of exactly one trade of 1K shares for $0.1039 on 2/24 (Monday), it was the first trade of the day and became the best offer at 09:28 as better offers from 08:00 through then of $0.096 from BTIG were removed. At 09:32, after the trade, offers from ATDF and others had been entered for $0.0958 and $0.096 and BTIG had moved its offer back to $0.1039 with TEJS.
I wonder why those better offers were removed. I can tell you from long observation that this is not normal behavior in this equity. NITE has done such occasionally, but normally the early bids and asks stay in place and new ones drip in as opening nears and then a bunch are entered at the open. I've seen this odd behavior before but was not then experienced enough to be suspicious of them or to try and put 2 + 2 together.
Regardless, for the rest of 2/24 day, the best offer I captured (and I captured a lot that particular day) was $0.096. I noted that day the next highest price seen was $0.0960 and if we used $0.0960 as the high, high movement was -1.03% instead of +7.11% and spread was 6.67% instead of 15.44%.
Note what has happened to VWAP and trade volume since Friday, 2/21. Keep in mind that price is most easily moved on low volume and 2/24 volume wasn't that, possibly accounting for the inability to "get it up", if someone was trying:
02/21 $0.0940 3243.91
02/24 $0.0927 3002.14
02/25 $0.0936 0632.77
02/26 $0.0962 0535.65
02/27 $0.0966 0817.14
02/28 $0.0974 0687.50
The stage is now set for next week's new shares to enter the market, likely at a price of $0.0766 to the PIPErs, which, if sold at the LOWEST VWAP from this week, can yield them a NICE FAT 21.02% PROFIT. If they can sell at Friday, 2/28's, VWAP, "FAT" goes to "OBESE" at 27.15%.
Congratulations to the PIPErs for another well-orchestrated and executed plan.
The question enters my mind: when do they start selling? Right away? Hold off a few days and see if they can push the market higher? I don't know. Looking at the charts around the start of each month might yield a clue. Most recently, February shares saw a good price rise for a week before the descent into the mud began. January shares just stayed sort of flat, but this was the first month of reduced payments at increased discounts. So I can't pick any period as a representative pattern.
Here's a trading breakdown by arbitrary time-frames.
09:30-09:30: 001500 shrs, 00.22% of vol, VWAP $0.0995, 100.0% buys
09:33-10:21: 091370 shrs, 13.10% of vol, VWAP $0.0978, 000.0% buys
10:40-12:09: 102130 shrs, 14.64% of vol, VWAP $0.0954, 055.9% buys
12:23-14:01: 053600 shrs, 07.68% of vol, VWAP $0.0976, 090.7% buys
14:01-14:20: 070000 shrs, 10.04% of vol, VWAP $0.0960, 000.0% buys
14:27-14:38: 210700 shrs, 30.21% of vol, VWAP $0.0989, 071.1% buys
14:40-15:17: 130700 shrs, 18.74% of vol, VWAP $0.0965, 003.8% buys
15:20-15:58: 037500 shrs, 05.38% of vol, VWAP $0.0985, 080.0% buys
Here's a breakdown by arbitrary price range.
$0.0952-$0.0955: 139130 shrs, 19.95% of vol, VWAP $0.0954, 038.9% buys
$0.0960-$0.0968: 160700 shrs, 23.04% of vol, VWAP $0.0965, 000.0% buys
$0.0970-$0.0979: 206370 shrs, 29.59% of vol, VWAP $0.0973, 034.7% buys
$0.0980-$0.0989: 025000 shrs, 03.58% of vol, VWAP $0.0984, 100.0% buys
$0.0990-$0.0999: 115600 shrs, 16.57% of vol, VWAP $0.0998, 078.4% buys
$0.1000-$0.1039: 050700 shrs, 07.27% of vol, VWAP $0.1002, 100.0% buys
Some day-to-day VWAP changes, with the end date shown and the percentage change from the prior day. Buy percentage is the last value on each line.
02/07 $0.1153 +02.56% 36.8%
02/10 $0.1128 -02.17% 26.6%
02/11 $0.1101 -02.35% 24.2%
02/12 $0.1046 -05.05% 46.6%
02/13 $0.1057 +01.12% 45.1%
02/14 $0.1020 -03.55% 17.7%
02/18 $0.0999 -02.08% 34.0%
02/19 $0.0981 -01.75% 43.6%
02/20 $0.0954 -02.76% 19.7%
02/21 $0.0940 -01.50% 50.1%
02/24 $0.0927 -01.30% 29.9%
02/25 $0.0936 +00.93% 47.9%
02/26 $0.0962 +02.80% 58.9%
02/27 $0.0966 +00.39% 43.8%
02/28 $0.0974 +00.82% 42.5%
Using the new 80% calculation 1/3 onward. This week's daily estimated values (older dailys in prior EOD posts in prior blog) for next share issue:
02/24: 20 lowest intra-day VWAPs in 40 days avg, $0.0962, x 80%: $0.0769
02/25: 20 lowest intra-day VWAPs in 40 days avg, $0.0960, x 80%: $0.0768
02/26: 20 lowest intra-day VWAPs in 40 days avg, $0.0960, x 80%: $0.0768
02/27: 20 lowest intra-day VWAPs in 40 days avg, $0.0958, x 80%: $0.0767
02/28: 20 lowest intra-day VWAPs in 40 days avg, $0.0957, x 80%: $0.0766
Vol in K, for above days: 3,002.14 632.77 535.65 817.14 687.50.
Week ending summaries of PIPE financing estimated 85% share pricing, "Dly Sht % of 'sells'", and inflection points here are omitted from the concentrator.
Week ending values related to the PIPE 85% (80% 1/3/14 forward) share pricing:
01/03: 20 lowest intra-day VWAPs in 40 days avg, $0.1066, x 80%: $0.0852 VWAP $0.0998
01/10: 20 lowest intra-day VWAPs in 40 days avg, $0.1039, x 80%: $0.0831 VWAP $0.1052
01/17: 20 lowest intra-day VWAPs in 40 days avg, $0.1011, x 80%: $0.0808 VWAP $0.1004
01/24: 20 lowest intra-day VWAPs in 40 days avg, $0.0996, x 80%: $0.0797 VWAP $0.0947
01/31: 20 lowest intra-day VWAPs in 40 days avg, $0.0973, x 80%: $0.0779 VWAP $0.0997
02/07: 20 lowest intra-day VWAPs in 40 days avg, $0.0973, x 80%: $0.0779 VWAP $0.1153
02/14: 20 lowest intra-day VWAPs in 40 days avg, $0.0973, x 80%: $0.0779 VWAP $0.1020
02/21: 20 lowest intra-day VWAPs in 40 days avg, $0.0966, x 80%: $0.0772 VWAP $0.0940
Vol, in thousands, for above weeks: 3,229 (4 days), 4,450, 3,657, 4,493 (4 day wk), 7,397, 8,900, 6,742, 7,753 (4 day wk).
On my ORIGINAL inflection point calculations, readings for 5, 10, 25, 50, 100 and 200 day periods:
---- 1-day change ----
02/19 +25.7% +04.6% +03.1% -00.3% -00.3% -00.6%
02/20 -53.6% -21.5% -09.1% -05.2% -02.2% -02.0%
02/21 +08.5% +01.8% +07.6% +00.6% +01.1% +00.1%
02/24 +00.4% -14.9% -11.0% -05.5% -02.6% -02.6%
02/25 +09.5% +06.5% -00.8% +01.2% +02.6% -00.1%
02/26 +13.1% +19.6% +00.3% +02.3% +01.5% +00.3%
02/27 +43.7% -02.6% +01.9% -00.1% +00.9% +00.1%
02/28 -15.2% +01.8% +08.2% +01.1% +00.7% +00.0%
---- 5-day change ----
02/19 +106.8% +016.6% +059.4% +120.0% +073.4% +027.0%
02/20 -1670.8% -086.4% -134.8% -1548.4% -664.1% -092.2%
02/21 +036.5% -023.6% +035.4% +003.2% +023.3% +011.1%
02/24 +098.6% +029.3% -010.4% -073.0% -006.6% -010.3%
02/25 +1607.8% +052.9% +041.5% +009.0% +054.1% +004.0%
02/26 -224.3% +087.0% -029.6% +029.5% +143.9% +016.9%
02/27 +1017.3% +618.2% +090.4% +077.7% +538.1% +048.0%
02/28 -024.1% -001.8% +075.2% +039.6% -009.6% -007.4%
---- 5-day rate of change ----
02/19 +289.3% -010.0% +110.4% +140.3% +2009.6% +151.4%
02/20 -104.6% -053.4% -774.0% -137.0% -154.6% -423.9%
02/21 +2217.6% -008.5% +078.0% +055.6% +040.1% +036.2%
02/24 +048.3% +058.6% +219.2% -411.1% +191.4% +025.3%
02/25 -036.4% +135.9% +260.7% -025.3% -045.7% +006.5%
02/26 -121.6% +108.0% -118.3% +002.9% +152.0% -014.6%
02/27 +1197.0% +164.5% +923.3% +166.5% +594.0% +327.7%
02/28 -028.9% +017.9% -033.7% +007.1% -016.3% -023.4%
On my NEWER inflection point calculations, for those same periods:
---- 1-day change ----
02/19 +026.05% +007.02% +004.25% +001.63% +001.58% +001.48%
02/20 -046.43% -017.01% -008.94% -005.35% -002.81% -002.81%
02/21 +006.23% -000.30% +005.64% +000.54% +001.43% +000.77%
02/24 +005.51% -006.28% -005.33% -001.32% +001.17% +001.36%
02/25 +017.90% +014.18% +008.69% +009.43% +010.52% +008.79%
02/26 +027.24% +031.98% +015.00% +015.29% +014.28% +014.35%
02/27 +050.06% +000.90% +005.42% +003.01% +003.85% +003.62%
02/28 -021.74% +003.56% +010.32% +003.31% +002.77% +002.17%
---- 5-day change ----
02/19 +104.18% +042.57% +057.07% +063.12% +058.47% +054.44%
02/20 -2158.18% -009.85% +016.37% +093.08% +114.49% +101.25%
02/21 +025.98% -056.46% -015.91% -1409.26% -538.96% -5494.71%
02/24 +137.83% +052.52% +054.84% +066.12% +159.78% +121.80%
02/25 +142.67% +100.39% +162.84% +275.02% +229.89% +425.50%
02/26 -018.62% +25397.52% +196.53% +242.71% +093.97% +120.46%
02/27 +378.81% +064.95% +084.57% +042.06% +024.89% +026.45%
02/28 -016.00% +006.44% +006.88% +007.74% +001.99% +003.15%
---- 5-day rate of change ----
02/19 +2231.13% +114.36% +263.20% +1446.58% +4271.01% +169818.42%
02/20 -021.24% +425.17% +067.24% +074.48% +095.09% +096.64%
02/21 +007.63% -204.00% -053.74% -057.86% -058.34% -058.78%
02/24 +032.92% +228.60% +091.08% +037.83% +058.96% +053.10%
02/25 -033.37% +069.05% +002.61% -021.97% -017.91% -018.79%
02/26 -078.15% +005.21% -029.71% -005.45% -006.03% -008.69%
02/27 +623.21% +034.59% +028.97% -001.20% -015.71% -020.72%
02/28 -018.72% +028.83% +010.09% +039.08% +029.04% +035.21%
Rolling 5-day ORIGINAL inflection point calculation aggregate change:
******* ******* *5 Day** *10 Day * * 25Day ** 50 Day **100Day* 200 Day
02/19 5 Day +0072.61 -1191.09 -0840.41 +0071.31 -0167.21 -1528.64
02/20 5 Day -1140.54 -2219.93 -1973.36 -1032.83 -1277.67 -2937.87
02/21 5 Day -0724.65 -2744.09 -1273.98 -0999.92 -0979.49 -2610.71
02/24 5 Day -0010.22 -1941.12 -1406.80 -1729.99 -1044.15 -2879.59
02/25 5 Day +0154.05 -0913.37 -0823.47 -1573.49 -0478.77 -2763.02
02/26 5 Day -0191.47 -0118.87 -1067.62 -1109.34 +0210.13 -2295.04
02/27 5 Day +1756.48 +0615.94 -0102.86 -0247.34 +1340.95 -1192.57
02/28 5 Day +1348.92 +0624.27 -0020.53 -0137.26 +1229.93 -1259.22
Average change/day, 5 days
____ **5 Day *10 Day *25 Day *50 Day 100 Day 200 Day
02/19 +267.26 -417.20 +039.03 +231.28 +184.33 +092.74
02/20 -012.23 -639.90 -263.11 -085.59 -100.71 -300.35
02/21 +258.96 -694.27 -057.90 -038.00 -060.38 -191.50
02/24 +384.14 -287.29 +069.02 -194.20 +055.17 -143.13
02/25 +244.29 +103.11 +248.93 -243.27 +029.94 -133.76
02/26 -052.82 +214.45 -045.44 -236.13 +075.47 -153.28
02/27 +579.40 +567.17 +374.10 +157.10 +523.72 +349.06
02/28 +414.71 +673.67 +250.69 +172.53 +441.88 +270.30
Rolling 5-day NEWER inflection point calculation aggregate change:
******* ******* *5 Day** *10 Day * * 25Day ** 50 Day **100Day* 200 Day
02/19 5 Day +0006.60 -0167.14 -0206.81 -0182.06 -0488.05 -1004.67
02/20 5 Day -0096.98 -0185.69 -0174.53 -0012.74 +0070.98 +0012.61
02/21 5 Day -0071.78 -0290.53 -0202.30 -0192.23 -0311.58 -0680.45
02/24 5 Day +0027.15 -0137.95 -0091.35 -0065.12 +0186.25 +0148.37
02/25 5 Day +0065.90 +0000.54 +0057.41 +0113.97 +0614.42 +0779.68
02/26 5 Day +0053.62 +0137.72 +0170.23 +0390.59 +1191.82 +1718.90
02/27 5 Day +0256.76 +0227.18 +0314.19 +0554.88 +1488.50 +2173.48
02/28 5 Day +0217.30 +0243.86 +0337.87 +0599.90 +1520.13 +2243.84
Average change/day, 5 days
____ **5 Day *10 Day *25 Day *50 Day 100 Day 200 Day
02/19 +0060.01 +0005.29 +0071.47 +0154.07 +0337.92 +0592.76
02/20 +0046.97 +0025.79 +0118.88 +0268.16 +0658.52 +1164.85
02/21 +0050.55 -0026.82 +0054.99 +0113.01 +0274.31 +0480.15
02/24 +0067.19 +0034.49 +0105.08 +0155.76 +0436.04 +0735.12
02/25 +0044.77 +0058.31 +0107.82 +0121.54 +0357.93 +0596.98
02/26 +0009.78 +0061.35 +0075.79 +0114.91 +0336.35 +0545.09
02/27 +0070.75 +0082.57 +0097.74 +0113.52 +0283.50 +0432.17
02/28 +0057.82 +0106.88 +0108.03 +0158.43 +0366.34 +0584.86
Dly Sht % of 'sells' values JIC it turns out to be useful...
============ 2013 ===============
Mon. 12/16: 31.39% 17.00% 35.06% 20.94% 2.10%
Mon. 12/23: 32.34% 24.95% 63.82% 32.86%
Mon. 12/30: 10.02% 6.65%
============ 2014 ===============
Thu. 01/02 12.17% 57.97% 130.29%
Mon. 01/06 130.29% 46.07% 45.62% 24.25% 69.90%
Mon. 01/13 15.61% 17.93% 32.12% 57.12% 108.76%
Tue. 01/21 110.53% 58.75% 49.16% 54.83%
Mon. 01/27 70.16% 9.32% 52.17% 23.63% 101.56%
Mon. 02/03 111.49% 65.83% 50.74% 39.44% 45.93%
Mon. 02/10 26.53% 34.19% 60.92% 50.15% 27.28%
Tue. 02/18 44.83% 53.95% 25.30% 46.39%
Mon. 02/24 23.26% 77.84% 112.52% 61.42% 60.59%
============ 2013 ===============
Oct Avg: 35.95%, min: 05.98%, max: 082.02%
Nov Avg: 28.42%, min: 05.99%, max: 050.60%
Dec Avg: 29.22%, min: 02.10%, max: 063.82%
============ 2014 ===============
Jan Avg: 54.66%, min: 09.32%, max: 130.29%
Feb Avg: 50.44%, min: 00.28%, max: 112.52%
0228 Vol 0687500, Sht 0239630 34.86% LHC 0.0952 0.1039 0.0975 b:s 1:1.35
0227 Vol 0817087, Sht 0282150 34.53% LHC 0.0950 0.1000 0.0952 b:s 1:1.28[127]
0226 Vol 0535651, Sht 0247426 46.19% LHC 0.0950 0.0970 0.0970 b:s 1.44:1
0225 Vol 0632768, Sht 0256707 40.57% LHC 0.0903 0.0974 0.0970 b:s 1:1.09[126]
0224 Vol 3002135, Sht 0489500 16.31% LHC 0.0900 0.1039 0.0910 b:s 1:2.34
0221 Vol 3243908, Sht 0719700 22.19% LHC 0.0910 0.0970 0.0915 b:s 1.05:1[125]
0220 Vol 1739714, Sht 0350800 20.16% LHC 0.0910 0.0994 0.0926 b:s 1:4.04[124]
0219 Vol 1885454, Sht 0563000 29.86% LHC 0.0950 0.1030 0.0964 b:s 1:1.27
0218 Vol 0872226, Sht 0260308 29.84% LHC 0.0975 0.1010 0.1000 b:s 1:1.95[123]
0214 Vol 2006349, Sht 0429309 21.40% LHC 0.1000 0.1064 0.1000 b:s 1:4.42[122]
0213 Vol 1880123, Sht 0513540 27.31% LHC 0.1040 0.1139 0.1042 b:s 1:1.21
0212 Vol 0252101, Sht 0082000 32.53% LHC 0.1031 0.1067 0.1045 b:s 1:1.15
0211 Vol 1805486, Sht 0452259 25.05% LHC 0.1021 0.1185 0.1060 b:s 1:3.02
0210 Vol 0798299, Sht 0155395 19.47% LHC 0.1025 0.1200 0.1140 b:s 1:2.76
0207 Vol 1974244, Sht 0570127 28.88% LHC 0.1101 0.1210 0.1113 b:s 1:1.71
0206 Vol 0665900, Sht 0132100 19.84% LHC 0.1085 0.1200 0.1131 b:s 1:1.04[121]
0205 Vol 0967658, Sht 0301064 31.11% LHC 0.1102 0.1220 0.1179 b:s 1:1.52[120]
0204 Vol 2174203, Sht 0848197 39.01% LHC 0.1026 0.1199 0.1199 b:s 1:1.46
0203 Vol 2989364, Sht 1411565 47.22% LHC 0.1001 0.1190 0.1020 b:s 1.32:1[119]
0131 Vol 2600482, Sht 1012719 43.88% LHC 0.0920 0.1130 0.0999 b:s 1.25:1[118]
0130 Vol 1104532, Sht 0210945 19.10% LHC 0.0909 0.0988 0.0915 b:s 1:8.38[117]
0129 Vol 0521125, Sht 0189844 36.43% LHC 0.0907 0.1000 0.0910 b:s 1:2.31 [116]
0128 Vol 1283588, Sht 0098700 07.69% LHC 0.0906 0.0919 0.0907 b:s 1:4.72
0127 Vol 1886785, Sht 0875619 46.41% LHC 0.0907 0.0970 0.0908 b:s 1:1.79[115]
0124 Vol 0486814, Sht 0201491 41.39% LHC 0.0905 0.0970 0.0950 b:s 1:3.15
0123 Vol 2069515, Sht 0709580 34.29% LHC 0.0900 0.1017 0.0940 b:s 1:2.53[114]
0122 Vol 0753817, Sht 0313100 41.54% LHC 0.0993 0.1040 0.0993 b:s 1:2.33[113]
0121 Vol 1162333, Sht 0587663 50.57% LHC 0.0960 0.1390 0.0985 b:s 1.13:1[112]
0117 Vol 0194787, Sht 0079500 40.81% LHC 0.0961 0.1098 0.0980 b:s 1.66:1
0116 Vol 0890792, Sht 0324000 36.37% LHC 0.0800 0.1050 0.0950 b:s 1:1.83
0115 Vol 0895136, Sht 0245533 27.43% LHC 0.0955 0.1010 0.0960 b:s 1:5.84[111]
0114 Vol 0743671, Sht 0091633 12.32% LHC 0.0960 0.1040 0.1000 b:s 1:2.08
0113 Vol 0904633, Sht 0104590 11.56% LHC 0.1005 0.1070 0.1005 b:s 1:3.79
0110 Vol 1967208, Sht 0532152 27.05% LHC 0.1006 0.1118 0.1026 b:s 1.49:1[110]
0109 Vol 0784373, Sht 0162000 20.65% LHC 0.1000 0.1055 0.1055 b:s 1:2.51[109]
0108 Vol 0535199, Sht 0164199 30.68% LHC 0.1000 0.1019 0.1010 b:s 1:2.05
0107 Vol 0849599, Sht 0279266 32.87% LHC 0.1000 0.1058 0.1000 b:s 1:2.60
0106 Vol 0163250, Sht 0056675 34.72% LHC 0.0990 0.1070 0.1040 b:s 2.64:1
0103 Vol 0331282, Sht 0104908 31.67% LHC 0.0953 0.1005 0.1003 b:s 1:1.20
0102 Vol 1429453, Sht 0115332 08.07% LHC 0.0960 0.1070 0.0960 b:s 1:1.97
[108] There was a pre-market trade of 10K that FINRA-reported daily short sales don't include. Adding that to the FINRA trade volume raises it from 993,469 to 1,003,469 and would lower the short percentage from 4.51% to 4.47%. If the shares are also added to the short sales, the short volume moves from 44,840 to 54,840 and the short percentage would be 5.66%.
[109] FINRA data was adjusted +23 on trade volume to account for a trade of that size that FINRA omits for some reason (bug somewhere). There was two after-hours trades of 145K and 5K that FINRA-reported daily short sales don't include. Adding that to the FINRA trade volume raises it from 784,373 to 934,373 and would lower the short percentage from 20.65% to 17.34%. If the shares are also added to the short sales, the short volume moves from 162,000 to 312,000 and the short percentage would be 34.69%.
[110] FINRA data was adjusted +08 on trade volume, from their 1,967,200 to the correct 1,967,208, to compensate for their inability to correctly report trade volume even after multiple reports, with snapshots, references and their attempts to provide a "work-around", which didn't.
[111] Initial FINRA data had no entry for AXPW, indicating 0 short sales. We didn't know if that was correct or they were just missing a big piece of the file. It turned out the whole entry was omitted and there are 245,533 shorts. Their daily trade volume was short 4 shares, as I originally posted would be the case, 2 trades of 2 shares each at $0.0960. The volume was adjusted appropriately.
[112] Initial FINRA data was missing 20K of trade volume for AXPW. This is large enough that it likely includes some short sales. If corrections come though, I'll update everything as needed. UPDATED! Next morning "work-around" did and 10K more of short sales appeared.
[113] Initial FINRA data was missing 20,087 of trade volume for AXPW. This is large enough that it likely includes some short sales. Corrections came through, but still missing 87 shares. Before corrections FINRA-reported trade volume was 753,817, short volume was 313100, yielding 40.46%. Corrected data, excluding the 87 shares, has trade volume of 773,817, short volume of 318,100, yielding 41.11%. With the 87 shares the percentage is 41.10%.
[114] Initial FINRA data was missing 82,141 shares of trade volume for AXPW. This is large enough that it likely included some short sales. Corrections came through, but still missing 141 shares. Before corrections FINRA-reported trade volume was 1,987,515, short volume was 709,580, yielding 35.70%. Corrected data, excluding the 141 shares, has trade volume of 2,069,515, short volume remained 709,580, yielding 34.29%. With the 141 shares the percentage is 34.28%.
[115] Initial FINRA data was missing 17,877 shares of trade volume for AXPW. This is small enough that it likely doesn't a substantial quantity of short sales. When corrections came through. Before corrections FINRA-reported trade volume was 1,868,908, short volume was 875,619, yielding 46.85%. Corrected data included no additional short sales, the daily short sales percentage moved to 46.41%.
[116] Initial FINRA data was missing 50 shares of trade volume for AXPW. This is small enough that it likely doesn't have any short sales. I corrected the data. Before corrections FINRA-reported trade volume was 521,075, short volume was 189,844, yielding 36.43%. With the additional 50 shares the daily short sales percentage was unchanged.
[117] FINRA data is missing 20 shares of trade volume for AXPW. The quantity is a single odd-lot trade and has no effect on eithr short sales volume or percentage. I adjusted the volume.
[118] FINRA data is missing 238,888 shares of trade volume for AXPW. The quantity is large enough that we should expect more short sales to appear Monday morning. I'll adjust everything when they appear. Using the initially reported FINRA volume of 2,361,594 and short volume of 1,012,719 the short percentage was 42.88%. I'm guesstimating around 55K more daily shorts. When correct volume appeared, shorts increase by more than double my estimate, which I based on shorts/buys, by 128,388. So a lot of sells were apparently short sales as well. New short volume is 1,141,107 and percentage is 43.88%.
[119] There was a pre-market trade of 5K that FINRA-reported daily short sales don't include. Adding that to the FINRA trade volume raises it from 2,989,364 to 2,994,364 and would lower the short percentage from 47.22% to 47.14%. If the shares are also added to the short sales, the short volume moves from 1,411,565 to 1,415,565 and the short percentage would be 47.31%.
[120] There was a pre-market trade of 15K that FINRA-reported daily short sales don't include. Adding that to the FINRA trade volume raises it from 967,658 to 982658 and would lower the short percentage from 31.11% to 30.64%. If the shares are also added to the short sales, the short volume moves from 301,064 to 316,064 and the short percentage would be 33.35%.
[121] There were 5 AH trades of totaling 109K that FINRA-reported daily short sales don't include. Adding that to the FINRA trade volume raises it from 665,900 to 774,900 and would lower the short percentage from 19.84% to 17.05%. If the shares are also added to the short sales, the short volume moves from 132,100 to 241,100 and the short percentage would be 32.59%. These were marked "seq", meaning they were traded during normal market hours but were not reported in a timely manner. With our buy percentage above 40% today I suspect a goodly portion of this 109K were short sales.
[122] FINRA data was missing 50 shares of trade volume for AXPW due to small odd lot trades. The initially reported FINRA volume was 2,006,299 and short volume was 429,269. When correct volume of 2,006,349 appeared, shorts increased by 40 shares, to 429,309. The change was small enough that no effect, to two decimal places, was seen, leaving the short percentage at 21.40%.
[123] There was 1 AH trade of 7K that FINRA-reported daily short sales don't include. Adding that to the FINRA trade volume raises it from 872,226 to 879,226 and would lower the short percentage from 29.84% to 29.61%. If the shares are also added to the short sales, the short volume moves from 260,308 to 267,308 and the short percentage would be 30.40%.
[124] There was 1 AH trade of 7K that FINRA-reported daily short sales don't include. Adding that to the FINRA trade volume raises it from 1,739,714 to 1,744,714 and would lower the short percentage from 20.16% to 20.11%. If the shares are also added to the short sales, the short volume moves from 350,800 to 355,800 and the short percentage would be 20.39%.
[125] FINRA data was missing 100 shares of trade volume for AXPW due to small odd lot trades. The initially reported FINRA volume was 3,243,808 and short volume was 719,671. When correct volume of 3,243,908 appeared, shorts increased by 29 shares, to 719,700. The change was small enough that no effect, to two decimal places, was seen, leaving the short percentage at 22.19%.
[126] FINRA data was missing 22 shares of trade volume for AXPW due to small odd lot trades. The initially reported FINRA volume was 632,746 and short volume was 256,707. When corrected volume of 632,768 appeared, shorts did not increase.
[127] FINRA data was missing 50 shares of trade volume for AXPW due to one small odd lot trade. The initially reported FINRA volume was 817,087 and short volume was 282,150. When corrected volume of 817,137 appears, shorts may increase, in which case I'll correct what's needed.
02/27/2014: EOD stuff partially copied to the concentrator.
# Trds: 65, MinTrSz: 50, MaxTrSz: 60000, Vol: 817137, AvTrSz: 12571
Min. Pr: 0.0950, Max Pr: 0.1000, VW Avg. Tr. Pr: 0.0966
# Buys, Shares: 28 357793, VW Avg Buy Pr: 0.0979
# Sells, Shares: 37 459344, VW Avg Sell Pr: 0.0956
# Unkn, Shares: 0 0, VW Avg Unk. Pr: 0.0000
Buy:Sell 1:1.28 (43.79% "buys"), DlyShts 282150 (34.53%), Dly Sht % of 'sells' 61.42%
The average of the lowest 20 VWAPs times 80% today is 02/27: 20 lowest intra-day VWAPs in 40 days avg, $0.0958, x 80%: $0.0767 vs. $0.0768, $0.0768, $0.0769, $0.0772, $0.0775, $0.0777, $0.0778, $0.0779 and $0.0779 on prior days. 80% of today's VWAP is $0.0773 vs. $0.0770, $0.0749, $0.0742, $0.0752, $0.0763, $0.0785, $0.0799, $0.0816 and $0.0846 on prior days. These are potential prices for the next tranche of shares to the PIPErs.
Today's low, high, VWAP, trade volume, and daily short sales moved 0.00%, 3.09%, 0.39%, 52.55% and 14.03% respectively. Price spread today was 5.26% vs. 7.86%, 15.44%, 6.59%, 9.23%, 8.42%, 3.59%, 6.40%, 9.52% and 3.49% on prior days.
In aggregate, my optimism that we won't see $0.08xx again took a small hit, mostly due to reducing volume with a volume rise on a lower close day, a few traditional TA indications and my newer experimental inflection point calculations.
On the traditional TA front, we had a reasonable spread and increased volume in a range that I think is reasonable, likely due to the less aggressive nature of ARCA and others today. But price remained "stable" for the third day as well with a high down only 3/10ths of a penny and a flat low of $0.095. Unfortunately we could not replicate yesterday's close at the open and high for the day. We opened at $0.095 and closed at $0.095, the low for the day. With a rise in volume, this suggests weakness.
The oscillators I watch had most not able to maintain the small positive moves of yesterday. Williams %R, which exited oversold two days back, descended back into oversold - barely though. RSI weakened from the ~45.7 to ~43.6. Momentum, which had achieved 0.8715 fell back to ~0.835. MACD remains essentially flat and it's histogram has slowed the rate of climb back up towards neutral, begun several days ago.
The items that maintained their trend were a mixed bag: full stochastic continues to rise after leaving oversold two days ago, ADX and related still can't do much but remain flat, MFI continues to weaken.
The short-term descending resistance I've been mentioning got it's first test today and passed - price pushed above it briefly and then fell back to close well below it. That resistance should be ~$0.098 today. The high of $0.10 also fell just short of the 50-day SMA, $0.1009. Remember that resistance drops roughly 9/10ths of a penny per week. I had mentioned this is the first thing to watch if we try to move up. The long-term descending resistance lays in wait as well, around $0.102.
When combined with previously falling volume, which I had mentioned might suggest a bottom was near, this is concerning. Relating to the weakening volume I had said "And from that "strength" we get two consecutive green candles with higher opens and two essentially flat high closes near the day's highs", as I was letting my TFH-inspired thoughts run about how the chart was manipulated. Looks like TFH might have been spot-on with today's rise in volume on a lower close.
Larger trades (>= 15K) occurred on 19 of 65 trades, 29.23%. These totaled 538,650 shares, 65.92% of days volume, and traded at a VWAP of $0.0968. 11 of these trades, 57.89%, were buys of 257,150 shares, 47.74% of the larger trades volume, which traded at a VWAP of $0.0982. 8 of the larger trades, 42.11%, were sells of 281,500 shares, 52.26% of the larger trades volume, which traded at a VWAP of $0.0955.
The rest of the trades, 278,487 shares representing 34.08% of day's volume, went at a VWAP of $0.0962.
ARCA was on the bid, but only somewhat similarly to what we've seen - in pre-market and out early, but later than before. Today, again, they appear on the bid pre-market, at $0.0901. They didn't disappear immediately after market open today. They left right when a trade went off at the third trade of the day at 9:50 for 10K shares at $0.0975. I don't know if ARCA was involved with that trade or not, but I know they disappeared simultaneously with that trade. There were no trades near the $0.0901 bid they had in.
On the sell side ARCA was not as passive as recently seen, but not as aggressive as seen in the past. They entered at 11:39 with a $0.097 offer, undercutting the best $0.0974 at the time, and moved to $0.0965 when BTIG joined them. They then moved back to $0.097 with BTIG and then back to $0.0965. When ARCA exited at 12:02, NITE took the lead with a $0.099 offer, followed by ATDF offering at $0.0998 when NITE dropped off. After the NITE buy-side action described next completed, ARCA returned at 12:31 with a $0.098 offer and tussled with BTIG and ATDF, finally settling at a $0.0965 offer by ARCA at 13:07. They stayed in the rest of the day with offers going no lower than $0.096 and hanging mostly around $0.0963/4.
A nice 2.52% bid improvement was seen when the best bid of $0.0951 moved to $0.0975 when NITE entered the buy side around twenty minutes after ARCA entered the sell side and had dropped the offer by 4/100ths of a penny. This was also just two minutes before ARCA left. 82,050 shares went at that price in the next 10 minutes, 1 "buy" of 57K and three trades totaling 25,050 shares as "sells". NITE then disappeared sometime between 12:10 and 12:16. ARCA then returned on the sell side with a $0.098 offer at 12:31.
In the non-traditional TA area, today's buy percentage of 43.8% was weaker than yesterday's 58.9%, up from 47.9%, but still better than Monday's (2/24) 29.9%. I mentioned yesterday that if it came with volume it would be very heartening but without volume it was what we've seen many times before with the PIPErs - low volume produces price stability and high buy percentages. Today's lower percentage fits with what might be expected with several days' lower volume after several days of extremely high volume.
If the volume was an indication of the exhaustion of PIPErs, it was certainly possible we could be seeing moves up. But my suspicious nature led me to think ...
The passive nature of ARCA the prior two days was characterized by me as a "tactical withdrawal" in preparation for the next assault. Today's return of ARCA, with a moderately aggressive behavior seems to support the "tactical withdrawal" thought.
Three days back I groused that the buy percentage didn't produce as big a short percentage as I would've expected and then the last two days the buy percentage popped up and daily short sales percentage rose just like it should. With today's slightly lower buy percentage, we also have a slightly lower daily short sale percentage, 34.53 vs. 46.19% and 40.57%. So that relationship seems to be intact again.
There is still a possibility that a change in behavior may be underway.
My original inflection point calculations, with one-day changes quite volatile recently, had only two periods up today, vs. all periods up yesterday. Aggregate change over five days showing all periods improving for the second day in a row, with rates of change going from yesterday's split with three improved and three weakened moving to all improving today.
The newer version has only one period in the one-day changes showing improvement, a switch from showing all periods improved over one day, to a small degree. The aggregate change over five days, which had the 5 and 25-day weakening while the other periods had marginal improvement, now has 5 weaker periods. The rate of change over those five days has four periods showing improvement.
Here's a trading breakdown by arbitrary time-frames.
09:30-09:30: 002900 shrs, 00.35% of vol, VWAP $0.0950, 000.0% buys
09:50-10:17: 054000 shrs, 06.61% of vol, VWAP $0.0969, 018.5% buys
10:47-11:46: 133000 shrs, 16.28% of vol, VWAP $0.0971, 100.0% buys
11:46-12:00: 105500 shrs, 12.91% of vol, VWAP $0.0953, 009.5% buys
12:02-12:30: 197350 shrs, 24.15% of vol, VWAP $0.0987, 087.3% buys
12:38-13:54: 091894 shrs, 11.25% of vol, VWAP $0.0953, 000.0% buys
14:17-14:46: 037493 shrs, 04.59% of vol, VWAP $0.0964, 086.7% buys
14:58-15:43: 195000 shrs, 23.86% of vol, VWAP $0.0955, 000.0% buys
Here's a breakdown by arbitrary price range.
$0.0950-$0.0955: 345794 shrs, 42.32% of vol, VWAP $0.0953, 000.0% buys
$0.0960-$0.0965: 102493 shrs, 12.54% of vol, VWAP $0.0963, 051.2% buys
$0.0970-$0.0975: 253550 shrs, 31.03% of vol, VWAP $0.0972, 074.9% buys
$0.0980-$0.0998: 065150 shrs, 07.97% of vol, VWAP $0.0992, 100.0% buys
$0.1000-$0.1000: 050150 shrs, 06.14% of vol, VWAP $0.1000, 100.0% buys
Some day-to-day VWAP changes, with the end date shown and the percentage change from the prior day. Buy percentage is the last value on each line.
02/06 $0.1124 -03.33% 41.7%
02/07 $0.1153 +02.56% 36.8%
02/10 $0.1128 -02.17% 26.6%
02/11 $0.1101 -02.35% 24.2%
02/12 $0.1046 -05.05% 46.6%
02/13 $0.1057 +01.12% 45.1%
02/14 $0.1020 -03.55% 17.7%
02/18 $0.0999 -02.08% 34.0%
02/19 $0.0981 -01.75% 43.6%
02/20 $0.0954 -02.76% 19.7%
02/21 $0.0940 -01.50% 50.1%
02/24 $0.0927 -01.30% 29.9%
02/25 $0.0936 +00.93% 47.9%
02/26 $0.0962 +02.80% 58.9%
02/27 $0.0966 +00.39% 43.8%
Using the new 80% calculation 1/3 onward. This week's daily estimated values (older dailys in prior EOD posts in prior blog) for next share issue:
02/24: 20 lowest intra-day VWAPs in 40 days avg, $0.0962, x 80%: $0.0769
02/25: 20 lowest intra-day VWAPs in 40 days avg, $0.0960, x 80%: $0.0768
02/26: 20 lowest intra-day VWAPs in 40 days avg, $0.0960, x 80%: $0.0768
02/27: 20 lowest intra-day VWAPs in 40 days avg, $0.0958, x 80%: $0.0767
Vol in K, for above days: 3,002.14 632.77 535.65 817.14.
Week ending summaries of PIPE financing estimated 85% share pricing, "Dly Sht % of 'sells'", and inflection points here are in the latest daily post above.
02/26/2014: EOD stuff partially copied to the concentrator.
# Trds: 55, MinTrSz: 701, MaxTrSz: 30000, Vol: 535651, AvTrSz: 9739
Min. Pr: 0.0950, Max Pr: 0.0970, VW Avg. Tr. Pr: 0.0962
# Buys, Shares: 31 315751, VW Avg Buy Pr: 0.0968
# Sells, Shares: 24 219900, VW Avg Sell Pr: 0.0955
# Unkn, Shares: 0 0, VW Avg Unk. Pr: 0.0000
Buy:Sell 1.44:1 (58.95% "buys"), DlyShts 247426 (46.19%), Dly Sht % of 'sells' 112.52%
The average of the lowest 20 VWAPs times 80% today is $0.0768 vs. $0.0768, $0.0769, $0.0772, $0.0775, $0.0777, $0.0778, $0.0779, $0.0779 and $0.0779 on prior days. 80% of today's VWAP is $0.0770 vs. $0.0749, $0.0742, $0.0752, $0.0763, $0.0785, $0.0799, $0.0816, $0.0846 and $0.0836 on prior days. These are potential prices for the next tranche of shares to the PIPErs.
Today's low, high, VWAP, trade volume, and daily short sales moved 5.20%, -0.41%, 2.80%, -15.35% and -3.62% respectively. Price spread today was 7.86% vs. 15.44%, 6.59%, 9.23%, 8.42%, 3.59%, 6.40%, 9.52%, 3.49% and 16.06% on prior days.
On the traditional TA front, we had a very narrow spread and, for the second consecutive day, lower volume. But price was "stable" for the second day as well with a high down only 4/100ths of a penny and a higher low of $0.095, up 47/100ths from yesterday's $0.0903. We also had a close at the open and high for the day. If we had volume I might be tempted to discard my TFH-inspired theories entirely. But sans volume, I remain in the camp of "evil is afoot" but must soften my conviction in light of the other factors.
Yesterday I detailed a new short-term descending resistance that was ~$0.10, very near the descending 50-day SMA of $0.1015 (I erroneously said $0.1012 - that's today's value). That descends $0.008944, call it 9/10ths of a penny, each week. So today we can say it's still at $0.10 and be in the ballpark. If we try to move up, this is the level to watch first. We still have the long-term descending resistance on the back burner and my intermediate-term descending support in play.
Yesterday I (lamented?) "At last I have a reason to change my thinking from my belief that we'll sink on down into at least the $0.08xx area again" and suggested that professional construction of a bullish chart pattern yielded better than a 50/50 chance of not going to $0.08xx again. Today continues that assessment, with the added caveat that I worry what happens on/after Monday (when new shares are issued?). On the sell side ARCA was passive yesterday and AWOL today, allowing price stability and a decent buy percentage two consecutive days. I assume they will know their price Friday. If they are still focused on getting cheap shares Friday would be the day for them to hammer I guess.
As with yesterday, it's still impressive what can be accomplished with a low-volume trading day. From Monday's 10-day average of ~1.784MM we did a paltry ~632.8K yesterday and ~535.6K today. And from that "strength" we get two consecutive green candles with higher opens and two essentially flat high closes near the day's highs. I mentioned this could be a bottoming process - low volume can suggest a trend may be ending.
Several of the oscillators I watch continued the positive ticks begun yesterday. Full stochastic continued to rise after leaving oversold yesterday while Williams %R, which also exited oversold yesterday, continued to rise marginally. RSI went flat again, holding at the ~45.7 it rose to yesterday. I'd feel better if that hadn't gone flat, but continued to rise. Momentum, which had recently risen from 76.31 to 0.8576, continues improvement with a reading today of 0.8715, still below neutral but making an effort to go positive. MACD, which had ceased accelerating downward and flattened out, remains essentially flat. It's histogram continues the move back up towards neutral, begun a couple days ago.
ADX and related stopped weakening yesterday and went flat, but is again weakening, albeit only marginally. MFI, which was late to begin a trend down continues sinking.
All told, this represents a time of uncertainty, due mostly to conflicting signals, compressing price and reducing volume while price moved up.
Larger trades (>= 15K) occurred on 12 of the 55 trades, 21.82%. These totaled 257,475 shares, 48.07% of days volume, and traded at a VWAP of $0.0964. 9 of these trades, 75.00%, were buys of 190,475 shares, 73.98% of the larger trades volume, which traded at a VWAP of $0.0967. 3 of the larger trades, 25.00%, were sells of 67,000 shares, 26.02% of the larger trades volume, which traded at a VWAP of $0.0954.
The rest of the trades, 278,176 shares representing 51.93% of day's volume, went at a VWAP of $0.0961.
In the non-traditional TA area, today's buy percentage of 58.9%, up from 47.9% and 29.9% the prior two days, is almost as strong as in "The Good Old Days" (TM). If it came with volume, it would be very heartening. As it is, I see it as what we've seen many times before with the PIPErs - low volume produces price stability and high buy percentages (remember when I was saying if we could stay around 7xxK I thought we could hold in the price range at the time?). If the volume is an indication of the exhaustion of PIPErs, it's certainly possible we could be seeing moves up. But my suspicious nature leads me to think ...
The passive nature of ARCA yesterday and absence today was a "tactical withdrawal" in preparation for the next assault. But that's not traditional TA, so I'll leave it there.
Two days back I groused that the buy percentage didn't produce as big a short percentage as I would've expected and I thought this was not good. Then yesterday the buy percentage popped up and daily short sales percentage rose just like it should. Today was a repeat. Two days of strong buy percentage, 47.9% and 58.9%, produced daily short sales in the area I would expect - 40.57% and 46.19%.
This still leaves in place the possibility that a change in behavior may be underway since we never got the leg down that past behavior suggested should have occurred. Check the chart and you'll see what makes me think a change may be under way.
On the bid side, ARCA has been doing something strange off and on. Today, again, they appear on the bid pre-market but disappear immediately after market opens - at least by 9:32 when I try and make an initial check. They did this Monday and a few other times over the last couple of weeks. Their bids are nothing extraordinary, usually being about third in line in a typical bottom-feeder stance. Don't know what's up with that.
On the ask side, ARCA was AWOL. Yesterday they were passive. Too soon to guess why, and with new shares about to spew forth, foolish to do so at this time.
My original inflection point calculations, with one-day changes quite volatile recently, had those changes with all periods up today, from five up yesterday. The changes, as usual, are quite small at this time. Aggregate change over five days, which had switched from all periods improving for three consecutive days to only the 5 and 10-day periods improving while the rest weaken, is now showing all periods improving. Rates of change are split with three improved and three weakened.
The newer version switched from one-day changes with all but the 200-day period weakening after all had improved the prior day, to a small degree, to showing all periods improved over one day, to a small degree. The aggregate change over five days now had all periods improving but today has the 5 and 25-day weakening while the other periods have marginal improvement. The BIG discrepancy seen yesterday in the rate of change over those five days - rate all weakening when all aggregate five day changes were improving yesterday - has dissipated with the rate of change being more in sync with the three shortest periods weakening, along with the 200-day period.
Regardless, for detecting likely changes, "Use the charts Luke"!
Here's a trading breakdown by arbitrary time-frames.
09:30-09:43: 073701 shrs, 13.76% of vol, VWAP $0.0967, 089.1% buys
09:47-11:40: 162900 shrs, 30.41% of vol, VWAP $0.0955, 032.2% buys
12:11-13:04: 113400 shrs, 21.17% of vol, VWAP $0.0964, 080.2% buys
13:08-14:27: 106000 shrs, 19.79% of vol, VWAP $0.0965, 044.3% buys
14:39-15:59: 079650 shrs, 14.87% of vol, VWAP $0.0967, 074.9% buys
Here's a breakdown by arbitrary price range.
$0.0950-$0.0952: 135900 shrs, 25.37% of vol, VWAP $0.0950, 003.7% buys
$0.0960-$0.0969: 322400 shrs, 60.19% of vol, VWAP $0.0966, 072.4% buys
$0.0970-$0.0970: 077351 shrs, 14.44% of vol, VWAP $0.0970, 100.0% buys
Some day-to-day VWAP changes, with the end date shown and the percentage change from the prior day. Buy percentage is the last value on each line.
02/05 $0.1163 +06.52% 39.6%
02/06 $0.1124 -03.33% 41.7%
02/07 $0.1153 +02.56% 36.8%
02/10 $0.1128 -02.17% 26.6%
02/11 $0.1101 -02.35% 24.2%
02/12 $0.1046 -05.05% 46.6%
02/13 $0.1057 +01.12% 45.1%
02/14 $0.1020 -03.55% 17.7%
02/18 $0.0999 -02.08% 34.0%
02/19 $0.0981 -01.75% 43.6%
02/20 $0.0954 -02.76% 19.7%
02/21 $0.0940 -01.50% 50.1%
02/24 $0.0927 -01.30% 29.9%
02/25 $0.0936 +00.93% 47.9%
02/26 $0.0962 +02.80% 58.9%
Using the new 80% calculation 1/3 onward. This week's daily estimated values (older dailys in prior EOD posts in prior blog) for next share issue:
02/24: 20 lowest intra-day VWAPs in 40 days avg, $0.0962, x 80%: $0.0769
02/25: 20 lowest intra-day VWAPs in 40 days avg, $0.0960, x 80%: $0.0768
02/26: 20 lowest intra-day VWAPs in 40 days avg, $0.0960, x 80%: $0.0768
Vol in K, for above days: 3,002.14 632.77 535.65.
Week ending summaries of PIPE financing estimated 85% share pricing, "Dly Sht % of 'sells'", and inflection points here are in the latest daily post above.
02/25/2014: EOD stuff partially copied to the concentrator.
# Trds: 65, MinTrSz: 22, MaxTrSz: 40000, Vol: 632768, AvTrSz: 9735
Min. Pr: 0.0903, Max Pr: 0.0974, VW Avg. Tr. Pr: 0.0936
# Buys, Shares: 37 302968, VW Avg Buy Pr: 0.0944
# Sells, Shares: 28 329800, VW Avg Sell Pr: 0.0929
# Unkn, Shares: 0 0, VW Avg Unk. Pr: 0.0000
Buy:Sell 1:1.09 (47.88% "buys"), DlyShts 256707 (40.57%), Dly Sht % of 'sells' 77.84%
The average of the lowest 20 VWAPs times 80% today is $0.0768 vs. $0.0769, $0.0772, $0.0775, $0.0777, $0.0778, $0.0779, $0.0779, $0.0779 and $0.0779 on prior days. 80% of today's VWAP is $0.0749 vs. $0.0742, $0.0752, $0.0763, $0.0785, $0.0799, $0.0816, $0.0846, $0.0836 and $0.0881 on prior days. These are potential prices for the next tranche of shares to the PIPErs.
Today's low, high, VWAP, trade volume, and daily short sales moved 0.33%, -6.26%, 0.93%, -78.92% and -47.56% respectively. Price spread today was 7.86% vs. 15.44%, 6.59%, 9.23%, 8.42%, 3.59%, 6.40%, 9.52%, 3.49% and 16.06% on prior days.
Larger trades (>= 15K) occurred on 12 of the 65 trades, 18.46%. These totaled 263,501 shares, 41.64% of days volume, and traded at a VWAP of $0.0938. 6 of these trades, 50.00%, were buys of 115,500 shares, 43.83% of the larger trades volume, which traded at a VWAP of $0.0942. 6 of the larger trades, 50.00%, were sells of 148,001 shares, 56.17% of the larger trades volume, which traded at a VWAP of $0.0935.
The rest of the trades, 369,267 shares representing 58.36% of day's volume, went at a VWAP of $0.0935.
At last I have a reason to change my thinking from my belief that we'll sink on down into at least the $0.08xx area again. The traditional TA stuff, along with some of my non-traditional stuff, suggests professional participation in constructing a bullish appearance on the charts. With their record of success any sensible person would give at least even odds they will be successful in producing results from this effort. I believe I'm sensible. So better than 50/50 is my assessment for now.
On the traditional TA front, if we had volume today (and/or no TFH) I would reverse yesterday's "The chance for continued support by my medium-term support grows increasingly suspect" and "I think Wednesday we are likely to be below the line into the $0.08xx area". With low volume and the recent evidence of manipulation attempts (my humble and TFH-influenced assessment) I remain skeptical of the TA indicators that would normally allow some possibility of bullish sentiment.
A little bad news is that I've identified a short-term descending resistance now that I have an origin at the high of 2/10, $0.12, and three touch points at the highs of 2/11 ($0.1185), 2/13 ($0.1139 and 2/24 ($0.1039). If we should by any accident make an attempt to move up, we should watch for this resistance, ~$0.10 today, very near the descending 50-day SMA of $0.1012.
It's impressive what can be accomplished with a low-volume trading day. As of Monday the 10-day average was ~1.784MM. Today a paltry ~632.8K. And from that "strength" we get a green candle with a higher open and close. Unfortunately, yesterday's 1K trade at $0.1039 spoiled today's party, preventing a higher high. Just shows that short-term thinking and poor planning can thwart the best laid plans of mice and men.
Keeping in mind that I discounted yesterday's 1K $0.1039 "high" and used $0.0960 instead, the lower highs ended at three in a row with today's $0.0974 high. We avoided continuing the lower lows string that restarted yesterday by posting a $0.0903, a whopping 3/100ths of a penny above yesterday's $0.09. We also broke the string of four consecutive lower closes with today's close of $0.097, well above the prior $0.091. The intra-day low, $0.0903, produced a very small gap above my intermediate-term descending support, ~$0.09 today AFAICT. If we had any volume I would be less jaundiced about what's going on. Of course this could be a bottoming process - low volume can suggest a trend may be ending.
Several of the oscillators I watch made the first positive ticks I've seen in a while. Full stochastic and Williams %R both moved out of oversold. RSI, which was weakening and went flat at ~37, "popped" up to ~45.7, still below neutral but improving. MFI, which was late to begin a trend down continues sinking. Momentum, which had finally stopped its down move at 77.18, up from the prior 76.31, is now up to 0.8576, still below neutral, but it is an improvement. ADX and related stopped weakening yesterday and is flat for now. MACD stopped accelerating downward and has flattened out while it's histogram has started moving back up towards neutral.
In the non-traditional TA area, today's buy percentage of 47.9%, up from yesterday's 29.9%, is almost as strong (in both magnitude and degree of improvement) as that of Friday 2/21, 50.1%, which was up from 19.7%. 2/21 had ~2.344MM in trading volume though and it resulted in a down day followed by another down day with buy percentage retreating to 29.9%. Let's hope that today's stronger percentage on lower volume can produce a much better result. If the volume is an indication of the exhaustion of PIPErs, it's certainly possible.
Yesterday I groused that the buy percentage didn't produce as big a short percentage as I would've expected and I thought this was not good. Without repeating my reasoning, yesterday's drop from 22.19% to 16.31% made me think the down leg I've been expecting had again finally started. I said I bet it's low again tomorrow, along with price. Well, any time the buy percentage is up in relative strong territory, daily short sales percentage should rise and I would be wrong again. It was, it did and I am again.
This does resurrect the possibility that a change in behavior may be underway. Take a look at the "AXWP Daily Volumes & Short Sales" chart and you'll see sound evidence that this question is worth asking.
ARCA was not on the bid today.
ARCA didn't appear on the offer until 10:50, they were uncharacteristically passive with only one move to $0.0935 from their initial offer of $0.94. They left at 12:46. That likely explains why we had a general trend of strengthening VWAP throughout the day (see trading breakdown by arbitrary times). I think it means the PIPErs were generally not aggressively in the market today. Given low volume with that, it's not surprising to see buy percentage and VWAP improve, along with daily short sales moved substantially upward.
My original inflection point calculations continue with the volatility in one-day changes. From all periods weakening, back to all showing improvement to a very small degree, to all weakening again, and now all improving by a smidgen. The net result, seen on the chart, is still a long slow weakening trend. Aggregate change over five days, which had switched from all periods improving for three consecutive days to only the 5 and 10-day periods improving while the rest weaken, is now showing all periods improving. Rates of change are split with three improved and three weakened.
The newer version switched from one-day changes with all but the 200-day period weakening after all had improved the prior day, to a small degree, to showing all periods improved over one day, to a small degree. This is the fifth day of flip-flopping, so the volatility is here also. The aggregate change over five days now has all periods improving. A BIG discrepancy appears in the rate of change over those five days - all weakening when all were improving yesterday. The changes are not tiny, but not real big either.
Keep in mind the chart patterns are the best indicator of if/when something is seriously about to change and I'm also suspicious of the utility of these items when we have the PIPE condition still in play. Having said that, the charts suggest that decline is weakening. It does not yet suggest that bullishness is in play yet.
Here's a trading breakdown by arbitrary time-frames.
09:30-09:35: 022499 shrs, 03.56% of vol, VWAP $0.0926, 077.8% buys
09:42-09:54: 054801 shrs, 08.66% of vol, VWAP $0.0938, 007.3% buys
10:15-10:50: 054000 shrs, 08.53% of vol, VWAP $0.0941, 081.5% buys
10:50-11:19: 061022 shrs, 09.64% of vol, VWAP $0.0914, 034.4% buys
12:15-12:35: 091000 shrs, 14.38% of vol, VWAP $0.0920, 022.0% buys
12:40-14:35: 078946 shrs, 12.48% of vol, VWAP $0.0929, 041.1% buys
14:46-14:59: 095500 shrs, 15.09% of vol, VWAP $0.0946, 078.5% buys
15:00-15:15: 092500 shrs, 14.62% of vol, VWAP $0.0945, 026.5% buys
15:49-15:59: 082500 shrs, 13.04% of vol, VWAP $0.0954, 078.2% buys
Here's a breakdown by arbitrary price range.
$0.0903-$0.0911: 040000 shrs, 06.32% of vol, VWAP $0.0908, 000.0% buys
$0.0920-$0.0929: 179999 shrs, 28.45% of vol, VWAP $0.0921, 026.7% buys
$0.0930-$0.0938: 116769 shrs, 18.45% of vol, VWAP $0.0935, 036.4% buys
$0.0944-$0.0948: 257500 shrs, 40.69% of vol, VWAP $0.0946, 067.6% buys
$0.0970-$0.0974: 038500 shrs, 06.08% of vol, VWAP $0.0973, 100.0% buys
Some day-to-day VWAP changes, with the end date shown and the percentage change from the prior day. Buy percentage is the last value on each line.
02/04 $0.1092 +05.16% 40.5%
02/05 $0.1163 +06.52% 39.6%
02/06 $0.1124 -03.33% 41.7%
02/07 $0.1153 +02.56% 36.8%
02/10 $0.1128 -02.17% 26.6%
02/11 $0.1101 -02.35% 24.2%
02/12 $0.1046 -05.05% 46.6%
02/13 $0.1057 +01.12% 45.1%
02/14 $0.1020 -03.55% 17.7%
02/18 $0.0999 -02.08% 34.0%
02/19 $0.0981 -01.75% 43.6%
02/20 $0.0954 -02.76% 19.7%
02/21 $0.0940 -01.50% 50.1%
02/24 $0.0927 -01.30% 29.9%
02/25 $0.0936 +00.93% 47.9%
Using the new 80% calculation 1/3 onward. This week's daily estimated values (older dailys in prior EOD posts in prior blog) for next share issue:
02/24: 20 lowest intra-day VWAPs in 40 days avg, $0.0962, x 80%: $0.0769
02/25: 20 lowest intra-day VWAPs in 40 days avg, $0.0960, x 80%: $0.0768
Vol in K, for above days: 3,002.14 632.77.
Week ending summaries of PIPE financing estimated 85% share pricing, "Dly Sht % of 'sells'", and inflection points here are in the latest daily post above.
02/24/2014: EOD stuff partially copied to the concentrator.
# Trds: 162, MinTrSz: 365, MaxTrSz: 110000, Vol: 3002135, AvTrSz: 18532
Min. Pr: 0.0900, Max Pr: 0.1039, VW Avg. Tr. Pr: 0.0927
# Buys, Shares: 59 897850, VW Avg Buy Pr: 0.0945
# Sells, Shares: 103 2104285, VW Avg Sell Pr: 0.0920
# Unkn, Shares: 0 0, VW Avg Unk. Pr: 0.0000
Buy:Sell 1:2.34 (29.91% "buys"), DlyShts 489500 (16.31%), Dly Sht % of 'sells' 23.26%
The average of the lowest 20 VWAPs times 80% today is $0.0769 vs. $0.0772, $0.0775, $0.0777, $0.0778, $0.0779, $0.0779, $0.0779, $0.0779 and $0.0779 on prior days. 80% of today's VWAP is $0.0742 vs. $0.0752, $0.0763, $0.0785, $0.0799, $0.0816, $0.0846, $0.0836 $0.0881 and $0.0902 on prior days. These are potential prices for the next tranche of shares to the PIPErs.
Today's low, high, VWAP, trade volume, and daily short sales moved -1.10%, 7.11%, -1.30%, -7.45% and -31.99% respectively. Price spread today was 15.44% vs. 6.59%, 9.23%, 8.42%, 3.59%, 6.40%, 9.52%, 3.49%, 16.06% and 17.07% on prior days.
It should be noted we had exactly one trade of 1K shares for $0.1039. The next highest price seen was $0.0960. If we used $0.0960 as the high, high movement was -1.03% instead of +7.11% and spread was 6.67% instead of 15.44%.
Larger trades (>= 15K) occurred on 59 of 162, 36.42%, trades. These totaled 2,194,150, 73.09% of days volume, and traded at a VWAP of $0.0927. 19 of these trades, 32.20%, were buys of 604,700 shares, 27.56%, of the larger trades volume, which traded at a VWAP of $0.0948. 40 of the larger trades, 67.80%, were sells of 1,589,450 shares, 72.44% of the larger trades volume, which traded at a VWAP of $0.0919.
The rest of the trades, 807,985 shares representing 26.91% of day's volume, went at a VWAP of $0.0930.
On the traditional TA front, I'm going to discount the garbage first. That single $0.1039 trade for 1000 shares strikes me as intentionally introduced noise. So although a typical chartist would see that as a higher high, indicating something useful about trading sentiment. I don't. I see it as someone being careless or intentionally distorting perceptions. I will use the $0.0960 I mentioned above as the high in my considerations.
The lower highs continued today, making three consecutive lower highs, and the string of lower lows restarted with a low of 186,650 shares in four trades at $0.0900. We now also have four consecutive lower closes. For the third straight day the intra-day low, $0.09, appears to be riding atop my intermediate-term descending support, ~$0.0905 today AFAICT. The close was up 1/10th at $0.0910.
Deep in oversold is full stochastic, which is flat, and Williams %R, also flat. RSI, which was weakening, is now flat at ~37, just above oversold of 30. MFI, which was had finally began a trend down has gone back to flat. Momentum finally stopped its down move at 77,18, up from yesterday's 76.31. This is still a far cry from hallelujah time though - remember we dropped from 0.9078 and 0.965 readings just four and three days ago. ADX and related stopped weakening. MACD and it's histogram are negative and continue accelerating downward.
Interesting that the lone $0.1039 trade of 1K shares "bumped it's head" on my long-term descending resistance. Even with that, six days we've traded completely below my longer-term descending resistance and, if we discount that "Lone Ranger", continue to depart from it to the downside at a high rate. It was "increasing rate", but now I can't tell for sure.
The chance for continued support by my medium-term support grows increasingly suspect. I said yesterday the combination of the oscillators' stances and the high volume leave me doubtful that it can do it another day or two. It did another day. The volume was high again today, on a down day, the "volume spike" which might have been signaling end of trend yesterday, wasn't. I think Wednesday we are likely to be below the line into the $0.08xx area.
The next potential support continues to be my long-term descending support, still around ~$0.081, very near the most recent new all-time low.
In the non-traditional TA area, today's buy percentage of 29.9%, down from 50.1% which was up from 19.7%, is not so much a sign of weak buying sentiment, I think, as it is a sign of the PIPErs, and maybe other, selling pressure. The common effect of falling price drawing in more buyers has limited effect over time as buyers become leery and exhausted at a given price level. I think that's what's going on here.
I said yesterday the buy percentage didn't produce as big a short percentage as I would've expected and I thought this was not good. It meant there's a lot more shares that are being handled by the MMs that are in their portfolios (likely from earlier covering buys and then shares backing processed sell orders flowing in), so they don't have to flag short, or there's a whole lot of intra/inter-broker trades going on. Today seems to bear this out as the lowered buy percentage finally let the daily short percentage show its true colors - down to 16.31% today. The down leg I've been expecting, which seemed determined to thwart me, has finally started (again?). We'll see, but I bet it's low again tomorrow, along with price.
There's no reason to change my thinking from my belief that we'll sink on down into at least the $0.08xx area again.
ARCA was again on the bid today from pre-market, not at 08:00 but at 09:05 when I checked again, and left right after the open, 09:32 or sooner. Of course, I still don't know why they've been doing this off and on.
ARCA didn't appear on the offer until 12:24. Even though they did another day of peek-a-boo, they manged to influence trading with their first offer of $0.095, just under the best $0.096. In 27 minutes they were at $0.094 and then left after a few minutes. On return at 13:03, $0.095 again. Left at 13:15 and returned at 14:21 with $0.095 again. Left at 14:44 and returned at 15:01 with a $0.92 offer. I couldn't track after 15:21 when ARCA was offering at $0.091.
Even with that, we had early pressure awaiting us as I saw an 867K offer at $0.096 from ATDF at 09:32 that was hidden quite a bit of the day. It became best offer at 10:47 but was again hidden by 10:51. It was at the top again at 11:07 with 706K remaining at $0.096. It got nibbled down for a good part of the day and ...
It looks like they capitulated with a $0.095 offer with 602.6K shares remaining at 14:21. At 15:01 a different offer at $0.093 with 462K appeared and after it was gone (gobbled up?) the $0.095 by 602.6K returned at 15:21.
My original inflection point calculations continues with the volatility. From all periods weakening two days prior, to all showing improvement to a very small degree, to all weakening today. The net result, seen on the chart, is a long slow weakening trend. Change over five days switched from all periods improving for three consecutive days to only the 5 and 10-day periods improving while the rest weaken. Rates of change switched from having all periods improving to three and three, reduced strengthening vs. increased strengthening.
The newer version, has all but the 200-day period weakening after all improved over one day, to a small degree, yesterday. They had just switched from all weakening two days ago. This is the fourth day of flip-flopping, so the volatility is here also. The aggregate change over five days now has only one period weakening whereas yesterday had all but the five-day period weakening. Rate of change, which had five weakening, now has all with improvement.
Keep in mind the chart patterns are the best indicator of if/when something is seriously about to change and I'm also suspicious of the utility of these items when we have the PIPE condition still in play.
Here's a trading breakdown by arbitrary time-frames.
09:30-09:30: 001000 shrs, 00.04% of vol, VWAP $0.1039, 100.0% buys
09:30-10:47: 125000 shrs, 05.23% of vol, VWAP $0.0958, 093.2% buys
10:48-11:13: 396250 shrs, 16.57% of vol, VWAP $0.0956, 049.7% buys
11:20-12:18: 331500 shrs, 13.86% of vol, VWAP $0.0955, 056.6% buys
12:19-12:59: 090570 shrs, 03.79% of vol, VWAP $0.0937, 033.1% buys
13:09-13:46: 070000 shrs, 02.93% of vol, VWAP $0.0946, 042.9% buys
14:05-14:23: 114500 shrs, 04.79% of vol, VWAP $0.0949, 060.7% buys
14:27-14:59: 082400 shrs, 03.45% of vol, VWAP $0.0936, 003.6% buys
15:00-15:00: 118300 shrs, 04.95% of vol, VWAP $0.0931, 000.0% buys
15:01-15:06: 216000 shrs, 09.03% of vol, VWAP $0.0919, 025.5% buys
15:20-15:24: 626915 shrs, 26.22% of vol, VWAP $0.0910, 004.7% buys
15:26-15:28: 212700 shrs, 08.90% of vol, VWAP $0.0901, 018.8% buys
15:30-15:59: 617000 shrs, 25.80% of vol, VWAP $0.0909, 022.5% buys
Here's a breakdown by arbitrary price range.
$0.0900-$0.0900: 186650 shrs, 06.22% of vol, VWAP $0.0900, 000.0% buys
$0.0901-$0.0905: 452415 shrs, 15.07% of vol, VWAP $0.0903, 008.8% buys
$0.0910-$0.0917: 768550 shrs, 25.60% of vol, VWAP $0.0911, 007.6% buys
$0.0920-$0.0925: 255000 shrs, 08.49% of vol, VWAP $0.0921, 060.8% buys
$0.0930-$0.0937: 240200 shrs, 08.00% of vol, VWAP $0.0932, 004.2% buys
$0.0940-$0.0940: 158070 shrs, 05.27% of vol, VWAP $0.0940, 014.6% buys
$0.0950-$0.0959: 624250 shrs, 20.79% of vol, VWAP $0.0954, 047.4% buys
$0.0960-$0.0960: 316000 shrs, 10.53% of vol, VWAP $0.0960, 099.5% buys
$0.1039-$0.1039: 001000 shrs, 00.03% of vol, VWAP $0.1039, 100.0% buys
Some day-to-day VWAP changes, with the end date shown and the percentage change from the prior day. Buy percentage is the last value on each line.
02/03 $0.1038 +04.14% 55.6%
02/04 $0.1092 +05.16% 40.5%
02/05 $0.1163 +06.52% 39.6%
02/06 $0.1124 -03.33% 41.7%
02/07 $0.1153 +02.56% 36.8%
02/10 $0.1128 -02.17% 26.6%
02/11 $0.1101 -02.35% 24.2%
02/12 $0.1046 -05.05% 46.6%
02/13 $0.1057 +01.12% 45.1%
02/14 $0.1020 -03.55% 17.7%
02/18 $0.0999 -02.08% 34.0%
02/19 $0.0981 -01.75% 43.6%
02/20 $0.0954 -02.76% 19.7%
02/21 $0.0940 -01.50% 50.1%
02/24 $0.0927 -01.30% 29.9%
Using the new 80% calculation 1/3 onward. This week's daily estimated values (older dailys in prior EOD posts in prior blog) for next share issue:
02/24: 20 lowest intra-day VWAPs in 40 days avg, $0.0962, x 80%: $0.0769
Vol in K, for above days: 3,002.14.
Week ending summaries of PIPE financing estimated 85% share pricing, "Dly Sht % of 'sells'", and inflection points here are in the latest daily post above.
02/21/2014: EOD stuff partially copied to the concentrator.
# Trds: 159, MinTrSz: 29, MaxTrSz: 125000, Vol: 3243908, AvTrSz: 20402
Min. Pr: 0.0910, Max Pr: 0.0970, VW Avg. Tr. Pr: 0.0940
# Buys, Shares: 77 1625042, VW Avg Buy Pr: 0.0947
# Sells, Shares: 76 1551396, VW Avg Sell Pr: 0.0932
# Unkn, Shares: 6 67470, VW Avg Unk. Pr: 0.0946
Buy:Sell 1.05:1 (50.10% "buys"), DlyShts 719700 (22.19%), Dly Sht % of 'sells' 46.39%
The average of the lowest 20 VWAPs times 80% today is $0.0772 vs. $0.0775, $0.0777, $0.0778, $0.0779, $0.0779, $0.0779, $0.0779, $0.0779 and $0.0779 on prior days. 80% of today's VWAP is $0.0752 vs. $0.0763, $0.0785, $0.0799, $0.0816, $0.0846, $0.0836 $0.0881, $0.0902 and $0.0922 on prior days. These are potential prices for the next tranche of shares to the PIPErs.
Today's low, high, VWAP, trade volume, and daily short sales moved 0.00%, -2.41%, -1.50%, 85.93% and 105.16% respectively. Price spread today was 6.59% vs. 9.23%, 8.42%, 3.59%, 6.40%, 9.52%, 3.49%, 16.06%, 17.07% and 9.90% on prior days.
Larger trades (>= 15K) occurred on 50 of the 159 trades, 31.45% of larger trades. These totaled 2,363,030, 72.85% of days volume, and traded at a VWAP $0.0940. 19 of these trades, 38.00%, were buys of 1,170,200 shares, 49.52% of the larger trades volume, which traded at a VWAP of $0.0950. 30 of the 50 trades, 60.00%, were sells of 1,175,360 shares, 49.74% of the larger trades volume, which traded at a VWAP of $0.0930. One trade, unknown, of 17,470 at $0.0921 was in these larger trades. Thirteen trades were over 50K, including twelve of 100K - 125K with a VWAP of $0.0944.
On the traditional TA front, the lower highs continued today, making two consecutive lower highs, and the string of lower lows got broken with a low that just matched yesterday's. The close yesterday of $0.0926 was just above my medium-term descending support, and today the low appear to be right on it at $0.091, and the close of $0.0915 just above it, so it did offer support two days at least.
Stochastic, which was flat in oversold, moved lower again, which I wouldn't have thought likely because it was so low. Williams %R was also flat in oversold and also moved lower. RSI continues to weaken, down to ~37 from ~38, just above oversold of 30. MFI, which was hesitant about making a strong trend as it remained generally flat, finally has two consecutive down days. Momentum continues to accelerate its down move, down at 76.31 from the two prior 0.9078 and 0.965 readings. ADX and related weakening continues. MACD and it's histogram are negative and accelerating downward, continuing the move seen yesterday.
Five days we've traded completely below my longer-term descending resistance and continue to depart from it to the downside at an increasing rate.
The chance for continued support by my medium-term support, of which I said yesterday "Friday's behavior will be important and give us a sign as to if we may get support, or not, at this level", is uncertain. Well, it gave us support, but the combination of the oscillators' stances and the high volume leave me doubtful that it can do it another day or two. The volume was high enough today, third highest since I started tracking this stuff in February of 2012, that maybe it was the "volume spike" signaling end of trend.
I don't know, all things considered, if we can read it that way. We know the PIPErs have caused some big volume with no change in sentiment or any catalysts AFAIK. So I would not suggest this is an end of trend, just out of caution.
The next potential support I see is my long-term descending support, currently ~$0.081, very near the most recent new all-time low.
In the non-traditional TA area, today's buy percentage of 50.1%, up from yesterday's 19.7%, is the highest since 1/31's and 2/3's 53.9% and 55.6%. This a common (side-?) effect of falling price though and is not much reason for hope. VWAP went from $0.0946 on 1/31 to a high of $0.1163 on 2/5 and started down from there. A four-day rise followed by a continuous trend lower is not exactly awe inspiring.
The buy percentage today didn't produce as big a short percentage as I would've expected. I think this is not good. It means there's a lot more shares that are being handled by the MMs that are in their portfolios (likely from earlier covering buys and then shares backing processed sell orders flowing in), so they don't have to flag short, or there's a whole lot of intra/inter-broker trades going on. This prevents the substantially reducing short percentage I've been expecting to appear. So yesterday's thought that the scenario I'd been expecting had begun is still not appearing even as price does move lower.
Regardless, I still think, for reasons mentioned above, my descending support won't hold and we'll sink on down into at least the $0.08xx area again.
I had mentioned the daily short percentage had been walking mostly sideways for a period longer than in the recent past - enough so that I began to wonder if a change in behavior was appearing. That possibility is still on the table.
ARCA was again on the bid today from pre-market, 09:05 when I checked, and exited by 09:42 or sooner. Why this behavior (in pre-market and out early with no activity at all that I detected) is beyond me, unless ... (adjusts TFH) They know I'm watching and keying on them and they are trying to confuse me. I'm half-joking here - nothing is beyond the TFH's possibilities!
ARCA was in on the offer at 09:32 again and stayed in all day again. They entered with a $0.095 offer, again matching BTIG, which was the best offer pre-market that I saw. ATDF and CDEL quickly jumped ahead of them, taking the ask to $0.0946 and those shares were snapped up, leaving ARCA now best at a higher $0.096 at 09:42.
Note this higher ask appeared when ARCA had exited the bid side, noticed at 09:42.
ARCA held that offer through 10:19 and around 10:43 the contentiousness started to get serious with BTIG, and ATDF jumping ahead. At 12:24 NITE joined. Prior to that, offers had held relatively well, only getting down to $0.095. NITE and ARCA joined at $0.095 and in 30 minutes we had $0.092 offers from ARCA with NITE second at $0.0925.
Things held steady there until ARCA's $0.0915 at 15:40 and their $0.0912 at 15:53.
What I find most interesting is that on a strong "buy" day we didn't see but a couple instances of offers rising - they were predominantly flat or falling most of the day. Of course, this is normal when ARCA is present as they seem to have little care for what price they offer at - very few trades actually take them off the offer. Either trades go around them or, quite likely, they have a lot more shares available than what is presented.
Early bids came in that cushioned a little bit for a little while. We had 100K and 99K from NITE and CDEL at 9:32 at different prices, 167K from ATDF around 13:58. Of course, when I say "a little cushion", these are a far cry from the 886K(?) we used to see sitting at $0.10 day after day. And those bids only gave us two days support once the rush started.
My original inflection point calculations have one day changes switched from all periods weakening yesterday to all showing improvement to a very small degree. Change over five days has all periods improving for the third day, with rates of change now having all periods improving. Keep in mind only volume and buy percentage are considered.
However, the newer version, which considers other factors, agrees in that all periods improved over one day, to a small degree, moving from all having weakening numbers on the changes yesterday. This is the third day of flip-flopping and I wouldn't assign much weight to anything under these conditions. The aggregate change over five days has all but the five-day period weakening. Rate of change has five weakening.
Repeating yesterdays caveat: it should be remembered that these are relative movements and not yet signs of price movement to come. The chart patterns are the best indicator of this. Also, I'm suspicious of the utility of these items when we have the PIPE condition still in play.
Here's a trading breakdown by arbitrary time-frames.
09:30-09:34: 005700 shrs, 00.18% of vol, VWAP $0.0926, 000.0% buys
09:37-09:46: 184300 shrs, 05.68% of vol, VWAP $0.0948, 070.5% buys
09:48-09:48: 248000 shrs, 07.65% of vol, VWAP $0.0969, 091.9% buys
09:51-10:18: 099000 shrs, 03.05% of vol, VWAP $0.0959, 021.2% buys
10:22-10:34: 039500 shrs, 01.22% of vol, VWAP $0.0954, 025.3% buys
10:40-10:40: 050000 shrs, 01.54% of vol, VWAP $0.0955, 040.0% buys
10:40-10:46: 500000 shrs, 15.41% of vol, VWAP $0.0956, 071.0% buys
10:47-11:44: 128500 shrs, 03.96% of vol, VWAP $0.0951, 007.8% buys
11:57-12:13: 321100 shrs, 09.90% of vol, VWAP $0.0937, 039.3% buys
12:14-12:36: 231360 shrs, 07.13% of vol, VWAP $0.0948, 089.0% buys
13:08-13:39: 119100 shrs, 03.67% of vol, VWAP $0.0938, 063.0% buys
13:40-14:13: 528000 shrs, 16.28% of vol, VWAP $0.0927, 055.0% buys
14:15-15:37: 642110 shrs, 19.79% of vol, VWAP $0.0921, 018.3% buys
15:43-15:58: 147238 shrs, 04.54% of vol, VWAP $0.0914, 024.5% buys
Here's a breakdown by arbitrary price range.
$0.0910-$0.0916: 174478 shrs, 05.38% of vol, VWAP $0.0913, 020.1% buys
$0.0920-$0.0929: 942370 shrs, 29.05% of vol, VWAP $0.0922, 023.8% buys
$0.0930-$0.0936: 470600 shrs, 14.51% of vol, VWAP $0.0931, 047.8% buys
$0.0940-$0.0949: 202729 shrs, 06.25% of vol, VWAP $0.0942, 067.2% buys
$0.0950-$0.0959: 949731 shrs, 29.28% of vol, VWAP $0.0952, 054.8% buys
$0.0960-$0.0965: 286000 shrs, 08.82% of vol, VWAP $0.0960, 093.0% buys
$0.0970-$0.0970: 218000 shrs, 06.72% of vol, VWAP $0.0970, 100.0% buys
Some day-to-day VWAP changes, with the end date shown and the percentage change from the prior day. Buy percentage is the last value on each line.
01/30 $0.0946 +03.55% 09.6%
01/31 $0.0997 +05.33% 53.9%
02/03 $0.1038 +04.14% 55.6%
02/04 $0.1092 +05.16% 40.5%
02/05 $0.1163 +06.52% 39.6%
02/06 $0.1124 -03.33% 41.7%
02/07 $0.1153 +02.56% 36.8%
02/10 $0.1128 -02.17% 26.6%
02/11 $0.1101 -02.35% 24.2%
02/12 $0.1046 -05.05% 46.6%
02/13 $0.1057 +01.12% 45.1%
02/14 $0.1020 -03.55% 17.7%
02/18 $0.0999 -02.08% 34.0%
02/19 $0.0981 -01.75% 43.6%
02/20 $0.0954 -02.76% 19.7%
02/21 $0.0940 -01.50% 50.1%
Using the new 80% calculation 1/3 onward. This week's daily estimated values (older dailys in prior EOD posts in prior blog) for next share issue:
02/18: 20 lowest intra-day VWAPs in 40 days avg, $0.0973, x 80%: $0.0778
02/19: 20 lowest intra-day VWAPs in 40 days avg, $0.0971, x 80%: $0.0777
02/20: 20 lowest intra-day VWAPs in 40 days avg, $0.0969, x 80%: $0.0775
02/21: 20 lowest intra-day VWAPs in 40 days avg, $0.0966, x 80%: $0.0772
Vol in K, for above days: 879.23 1,885.45 1,744.71 3,243.91.
Week ending summaries of PIPE financing estimated 85% share pricing, "Dly Sht % of 'sells'", and inflection points here are are in the latest daily post above.
02/20/2014: EOD stuff partially copied to the concentrator.
# Trds: 114, MinTrSz: 50, MaxTrSz: 80000, Vol: 1744714, AvTrSz: 15305
Min. Pr: 0.0910, Max Pr: 0.0994, VW Avg. Tr. Pr: 0.0954
# Buys, Shares: 35 343210, VW Avg Buy Pr: 0.0966
# Sells, Shares: 77 1386504, VW Avg Sell Pr: 0.0951
# Unkn, Shares: 2 15000, VW Avg Unk. Pr: 0.0963
Buy:Sell 1:4.04 (19.67% "buys"), DlyShts 3508000 (20.11%), Dly Sht % of 'sells' 25.30%
There was 1 AH trade of 7K that FINRA-reported daily short sales don't include. Adding that to the FINRA trade volume raises it from 1,739,714 to 1,744,714 and would lower the short percentage from 20.16% to 20.11%. If the shares are also added to the short sales, the short volume moves from 350,800 to 355,800 and the short percentage would be 20.39%.
The average of the lowest 20 VWAPs times 80% today is $0.0775 vs. $0.0777, $0.0778, $0.0779, $0.0779, $0.0779, $0.0779, $0.0779, $0.0779and $0.0779 on prior days. 80% of today's VWAP is $0.0763 vs. $0.0785, $0.0799, $0.0816, $0.0846, $0.0836 $0.0881, $0.0902, $0.0922 and $0.0899 on prior days. These are potential prices for the next tranche of shares to the PIPErs.
Today's low, high, VWAP, trade volume, and daily short sales moved -4.21%, -3.50%, -2.76%, -7.46% and -37.70% respectively. Price spread today was 9.23% vs. 8.42%, 3.59%, 6.40%, 9.52%, 3.49%, 16.06%, 17.07%, 9.90% and 10.60% on prior days.
Larger trades (>= 15K) occurred on 38 of the 114 trades, 33.33%. These totaled 1,174,761 shares, 67.33% of days volume, and traded at a VWAP $0.0952. 6 of these trades, 15.79%, were buys of 150,300 shares, 12.79% of the larger trades volume, which traded at a VWAP of $0.0990. 32 of the 38 trades, 84.21%, were sells of 1,024,461 shares, 87.21% of the larger trades volume, which traded at a VWAP of $0.0950.
On the traditional TA front, the lower highs returned today and he string of lower lows is intact. We now have three of the last four days with lower highs and four of four with lower lows. Our low penetrated my descending intermediate-term support, ~$0.092(?) today, but came right back to, and above, it. Our close of $0.0926 was just above it, so it did offer support today at least.
Stochastic is flat in oversold again and Williams %R is flat in oversold as well. RSI continues to weaken, down to ~38, just above oversold of 30. MFI continues to be hesitant about making a strong trend, remaining generally flat, and momentum accelerates its down move, down at 0.9078 from yesterday's 0.965. ADX and related weakening is going from flat to weakening again. MACD and it's histogram are negative and accelerating downward, along with the average now.
Four days now we've traded completely below my longer-term descending resistance and.
The chance for support remains my medium-term former descending resistance, which we penetrated and recovered to above it for the close today. Four days ago it was at ~$0.0927, AFAICT, and descending at ~$0.003/week, so it should be around $0.092 now. Friday's behavior will be important and give us a sign as to if we may get support, or not, at this level.
The low buy percentage today, 19.7%, finally allowed the reducing short percentage I've been expecting to appear, 20.1% today. I think today began the scenario I'd been expecting when I said "If the buy percentage collapses, which I think it will soon, daily short sales percentage and price will both fall, maybe more heavily than it's already falling". If this is the start of the scenario, my descending support won't hold and we'll sink on down into at least the $0.08xx area again.
But this is not a given scenario. The daily short percentage has been walking mostly sideways for a period longer than in the recent past - enough so that I began to wonder if a change in behavior was appearing. That possibility is still there because today's percentage could be nothing more than another leg in the vacillation around some new flattish, or other, trend.
ARCA was on the bid today from pre-market, 09:20 when I checked, and exited by 10:18 or sooner. They were not playing any games though - planted a bid of 30K at $0.0901 and never moved it that I saw.
ARCA was in on the offer at 09:32 and stayed in almost all day again, exiting at 15:40. The entered with a $0.10 offer, matching BTIG. They tussled with ATDF, CDEL and NITE and best offer was down to $0.0974 by 9:52. At 10:19 ARCA was back at $0.10 and best offer was back up to $0.0994. It didn't last as ARCA got all frisky again in nine minutes and offers were back down to $0.0974 by 10:35, $0.097 by 11:15$0.0969 by 12:01, $0.096 by 13:31, ... and $0.094 by 15:21.
Bids came in that cushioned a little bit for a little while. At 10:26 ATDF had a 100K bid at $0.096 and ETRF had 149K bid at $0.095. But with the day's volume and aggression on the sell side, when the sellers got busy the quantity was nothing more than an appetizer as we moved to trading as low as $0.091.
Regarding both my inflection point calculations, I warned yesterday that "It should be remembered that these are relative movements and not yet signs of price movement to come. The chart patterns are the best indicator of this, as can be seen as it predicted ..." and I listed the VWAPs since.
I can't suggest that either version is fine-grained enough to predict today's, or any single day's, movement. But I can and do note that no pattern of bullishness was on the horizon because we didn't have the pattern.
I wanted to mention this because I hadn't touched on it for a long time and it's easy to overlook just how they may and may not be useful.
This might be an appropriate place to remind that the original version considers only volume and buy percentage. So it can be all happy face as other metrics, such as price, go into the can.
My original inflection point calculations have one day changes with all periods weakening. Change over five days has all periods improving for the second day, with rates of change doing the same but for one period weakening yesterday.
The newer version disagrees in that all periods deteriorated over one day, moving from all having positive numbers on the changes yesterday to all having negative numbers on today's changes - no changes just of magnitude but maintaining sense of negative or positive. The aggregate change over five days has a split of three periods improving and three weakening. Rate of change has five weakening.
Repeating yesterdays caveat: it should be remembered that these are relative movements and not yet signs of price movement to come. The chart patterns are the best indicator of this.
Here's a trading breakdown by arbitrary time-frames.
09:47-10:19: 043404 shrs, 02.49% of vol, VWAP $0.0974, 072.6% buys
10:20-10:29: 157911 shrs, 09.05% of vol, VWAP $0.0980, 030.4% buys
10:44-10:59: 240000 shrs, 13.76% of vol, VWAP $0.0961, 000.0% buys
11:00-11:43: 057000 shrs, 03.27% of vol, VWAP $0.0969, 057.9% buys
11:54-12:01: 249100 shrs, 14.28% of vol, VWAP $0.0952, 000.0% buys
12:06-12:28: 120000 shrs, 06.88% of vol, VWAP $0.0956, 032.6% buys
13:03-13:56: 111000 shrs, 06.36% of vol, VWAP $0.0965, 072.1% buys
14:02-14:59: 206000 shrs, 11.81% of vol, VWAP $0.0956, 015.0% buys
15:00-15:09: 223760 shrs, 12.83% of vol, VWAP $0.0953, 006.7% buys
15:09-15:11: 100700 shrs, 05.77% of vol, VWAP $0.0936, 015.6% buys
15:12-15:27: 140839 shrs, 08.07% of vol, VWAP $0.0919, 000.0% buys
15:38-15:40: 040000 shrs, 02.29% of vol, VWAP $0.0945, 100.0% buys
15:45-16:00: 055000 shrs, 03.15% of vol, VWAP $0.0927, 018.2% buys
Here's a breakdown by arbitrary price range.
$0.0910-$0.0926: 185839 shrs, 10.65% of vol, VWAP $0.0921, 000.0% buys
$0.0930-$0.0931: 070000 shrs, 04.01% of vol, VWAP $0.0930, 014.3% buys
$0.0940-$0.0945: 060700 shrs, 03.48% of vol, VWAP $0.0942, 058.8% buys
$0.0950-$0.0955: 716560 shrs, 41.07% of vol, VWAP $0.0952, 003.5% buys
$0.0960-$0.0965: 380000 shrs, 21.78% of vol, VWAP $0.0961, 017.8% buys
$0.0970-$0.0979: 233615 shrs, 13.39% of vol, VWAP $0.0971, 068.4% buys
$0.0980-$0.0980: 060000 shrs, 03.44% of vol, VWAP $0.0980, 011.7% buys
$0.0994-$0.0994: 038000 shrs, 02.18% of vol, VWAP $0.0994, 100.0% buys
Some day-to-day VWAP changes, with the end date shown and the percentage change from the prior day. Buy percentage is the last value on each line.
01/29 $0.0914 +00.60% 30.2%
01/30 $0.0946 +03.55% 09.6%
01/31 $0.0997 +05.33% 53.9%
02/03 $0.1038 +04.14% 55.6%
02/04 $0.1092 +05.16% 40.5%
02/05 $0.1163 +06.52% 39.6%
02/06 $0.1124 -03.33% 41.7%
02/07 $0.1153 +02.56% 36.8%
02/10 $0.1128 -02.17% 26.6%
02/11 $0.1101 -02.35% 24.2%
02/12 $0.1046 -05.05% 46.6%
02/13 $0.1057 +01.12% 45.1%
02/14 $0.1020 -03.55% 17.7%
02/18 $0.0999 -02.08% 34.0%
02/19 $0.0981 -01.75% 43.6%
02/20 $0.0954 -02.76% 19.7%
Using the new 80% calculation 1/3 onward. This week's daily estimated values (older dailys in prior EOD posts in prior blog) for next share issue:
02/18: 20 lowest intra-day VWAPs in 40 days avg, $0.0973, x 80%: $0.0778
02/19: 20 lowest intra-day VWAPs in 40 days avg, $0.0971, x 80%: $0.0777
02/20: 20 lowest intra-day VWAPs in 40 days avg, $0.0969, x 80%: $0.0775
Vol in K, for above days: 879.23 1,885.45 1,744.71.
Week ending summaries of PIPE financing estimated 85% share pricing, "Dly Sht % of 'sells'", and inflection points here are in the latest daily post above.
02/19/2014: EOD stuff partially copied to the concentrator.
# Trds: 117, MinTrSz: 100, MaxTrSz: 110000, Vol: 1885454, AvTrSz: 16115
Min. Pr: 0.0950, Max Pr: 0.1030, VW Avg. Tr. Pr: 0.0981
# Buys, Shares: 49 821450, VW Avg Buy Pr: 0.0991
# Sells, Shares: 67 1043492, VW Avg Sell Pr: 0.0974
# Unkn, Shares: 1 20512, VW Avg Unk. Pr: 0.0975
Buy:Sell 1:1.27 (43.57% "buys"), DlyShts 563000 (29.86%), Dly Sht % of 'sells' 53.95%
The average of the lowest 20 VWAPs times 80% today is $0.0777 vs. $0.0778, $0.0779, $0.0779, $0.0779, $0.0779, $0.0779, $0.0779, $0.0779 and $0.0779 on prior days. 80% of today's VWAP is $0.0785 vs. $0.0799, $0.0816, $0.0846, $0.0836 $0.0881, $0.0902, $0.0922, $0.0899 and $0.0930 on prior days. These are potential prices for the next tranche of shares to the PIPErs.
Today's low, high, VWAP, trade volume, and daily short sales moved -2.56%, 1.98%, -1.75%,114.44% and 116.28% respectively. Price spread today was 8.42% vs. 3.59%, 6.40%, 9.52%, 3.49%, 16.06%, 17.07%, 9.90%, 10.60% and 10.71% on prior days.
There were trades I considered notable, due to the influence of my TFH. I felt like someone was trying to fool us (me?). They set the high for the day. There were no other trades at or near these prices, as the next highest was $0.1018. I figured I'd just show them and let you decide if it's worth being suspicious or not. The second occurrences are also curious to me as at the time those later trades were done, the trades around them were $0.1018 for 45K just before and $0.1009 for 3k just after.
09:30:05 $0.10301000
09:30:07 $0.102910000
11:38:23 $0.102910000
11:38:26 $0.103039900
Removing them would put changes for our low, high and VWAP to -2.56%, 0.79%, -1.91% ($0.0979 instead of $0.0981). Price spread would be only 7.16%. It would also affect the traditional charts as the higher high today would be much less pronounced. However, due to the volumes and multiple occurrences, I think my TFH is off base this time.
Larger trades (>= 15K) occurred on 29 of the 117 trades today, 24.79%. These totaled 1,203,954 shares, 63.85% of days volume, and traded at a VWAP $0.0981. 11, 37.93% of these 29 trades, were buys of 537,900 shares, 44.68% of the larger trades volume, that traded at a VWAP of $0.0990. 17 of the 29 trades, 58.62%, were sells of 645,542 shares, 53.62% of the larger trades volume, that traded at a VWAP of $0.0974. There was one trade that was unknown for 20,512 shares, 1.70% of the larger trades volume, that traded at $0.0975.
There were some larger trades that were notable for being greater than 50K:
70,000 at $0.0976, 85,000 at $0.0980, 100,000 at $0.0951, 108,000 at $0.0970, 110,000 at $0.0990.
I've not looked at average trade size and price relation for a while. Last I recall I mentioned with larger "present" size due to lower price I thought it would settle somewhere in the 7K or 8K range? Don't remember and not worth looking up. Anyway, one of the things, long ago, that I used to watch for signs of appreciation was average trade size. If it went up, we would see some appreciation. No more. Both spikes and averages, for now, seem an effect of constantly falling price and not a sign of appreciation. Probably due to PIPErs.
10, 25, 50 and 100-day average trade sizes, respectively: 11,216, 10,877, 10,107, 9,348.
On the traditional TA front, the string of lower highs is broken (even excluding those $0.1029 and $0.1030 trades, we have a $0.1018 high, above yesterday's high of $0.101). The string of lower lows is intact though.
Stochastic has flattened out in oversold today and Williams %R got there today. RSI continues to weaken, down to ~42 from ~45, below neutral since Thursday 2/13. MFI continues to be hesitant about making a strong trend, now going flat and momentum has finally started decisively down, now at 0.965. ADX and related weakening went from a slightly more pronounced downward trend to flat. MACD and it's histogram has gone negative.
Yesterday I mentioned a possible hopeful sign, albeit a weak one IMO given current conditions and past behavior, was that volume was lower and I said maybe we'll stabilize here for a day or two, but I wasn't all that optimistic about that.
A lower close, below $0.10, with rising volume today shoots that hope down.
Three days now we've traded completely below my longer-term descending resistance (formerly support) and, as I mentioned yesterday, we are separating from it as price descends faster than the line, ~$0.0028/week.
The best, and closest, chance for support remains my medium-term former descending resistance. Three days ago it was at ~$0.0927, AFAICT, and descending at ~$0.003/week, so it should be around $0.0925 now.
The buy percentage action shot down my thoughts that we'd see reducing short percentage as we know that a high buy percentage produces higher daily short sales percentage. Both remained relatively high at 43.6% buys and 29.86% daily short percentage. Regardless, we again got the lower prices (note the percentage reductions in low, high and VWAP above). If the buy percentage collapses, which I think it will soon, daily short sales percentage and price will both fall, maybe more heavily than it's already falling.
ARCA was not on the bid today.
ARCA was in at 10:01 and stayed in all day again. The entered with a $0.1018 offer, undercutting the $0.1029 best t the time. Unlike yesterday, when they weren't all that aggressive, they and ATDF immediately got into it and best offer was down to $0.1009 in just 12 minutes at 10:13. NITE joined the fray at 10:44 with them and ARCA both offering at $0.10. By 11:20 offer was down to $0.0985 from NITE, $0.099 from ATDF and ARCA had retreated to $0.101. Some heavy buying ensued and the lower offers got cleared and offer was up to $0.103 by 11:38. Didn't last long and by 11:52 it was down to $0.1005 from ARCA. Offer bottomed at $0.096 at 13:34. It spent the rest of the day in the $0.096-$0.097 range, mostly, after peaking at 13:42 with a $0.0995 offer from ARCA.
Bids remained very stable from 10:44 on, vacillating in the $0.095-$0.0975 range, centered around $0.096x.
Regarding my original inflection point calculations, the one day changes with all periods strengthening has the three shorter periods improving while the longer periods weaken. Change over five days has improved again from five periods improving to all improving, with rates of change doing the same.
The newer version agrees in that all periods improved over one day, giving five out of six days showing improvement, generally. The aggregate change over five days shows all periods improving, as does rate of change. All are small changes thus far.
It should be remembered that these are relative movements and not yet signs of price movement to come. The chart patterns are the best indicator of this, as can be seen as it predicted the recent weakening with strong correlation among the periods starting a "choreographed" move down on 2/5 (when the five-day calculation was in positive territory for the second day), confirmed by VWAPs 2/5 and forward: $0.1163, $0.1124, $0.1153, $0.1128, $0.1101, $0.1046, $0.1057, $0.1020, $0.0999 and $0.0981
Here's a trading breakdown by arbitrary time-frames.
09:30-09:30: 011000 shrs, 00.58% of vol, VWAP $0.1029, 100.0% buys
09:38-10:44: 222342 shrs, 11.79% of vol, VWAP $0.1000, 000.0% buys
11:20-11:35: 201000 shrs, 10.66% of vol, VWAP $0.0989, 086.6% buys
11:36-11:51: 238000 shrs, 12.62% of vol, VWAP $0.1013, 100.0% buys
11:58-12:41: 446512 shrs, 23.68% of vol, VWAP $0.0980, 029.2% buys
12:42-13:33: 381000 shrs, 20.21% of vol, VWAP $0.0960, 042.8% buys
13:35-14:43: 228100 shrs, 12.10% of vol, VWAP $0.0965, 013.2% buys
14:44-15:58: 157500 shrs, 08.35% of vol, VWAP $0.0971, 047.8% buys
Here's a breakdown by arbitrary price range.
$0.0950-$0.0956: 206000 shrs, 10.93% of vol, VWAP $0.0953, 000.0% buys
$0.0960-$0.0965: 248100 shrs, 13.16% of vol, VWAP $0.0962, 022.2% buys
$0.0970-$0.0977: 533462 shrs, 28.29% of vol, VWAP $0.0973, 033.0% buys
$0.0980-$0.0989: 191350 shrs, 10.15% of vol, VWAP $0.0982, 055.6% buys
$0.0990-$0.0994: 185200 shrs, 09.82% of vol, VWAP $0.0990, 100.0% buys
$0.1000-$0.1009: 370442 shrs, 19.65% of vol, VWAP $0.1000, 040.0% buys
$0.1010-$0.1018: 090000 shrs, 04.77% of vol, VWAP $0.1015, 100.0% buys
$0.1029-$0.1030: 060900 shrs, 03.23% of vol, VWAP $0.1030, 100.0% buys
Some day-to-day VWAP changes, with the end date shown and the percentage change from the prior day. Buy percentage is the last value on each line.
01/28 $0.0908 -01.82% 17.5%
01/29 $0.0914 +00.60% 30.2%
01/30 $0.0946 +03.55% 09.6%
01/31 $0.0997 +05.33% 53.9%
02/03 $0.1038 +04.14% 55.6%
02/04 $0.1092 +05.16% 40.5%
02/05 $0.1163 +06.52% 39.6%
02/06 $0.1124 -03.33% 41.7%
02/07 $0.1153 +02.56% 36.8%
02/10 $0.1128 -02.17% 26.6%
02/11 $0.1101 -02.35% 24.2%
02/12 $0.1046 -05.05% 46.6%
02/13 $0.1057 +01.12% 45.1%
02/14 $0.1020 -03.55% 17.7%
02/18 $0.0999 -02.08% 34.0%
02/19 $0.0981 -01.75% 43.6%
Using the new 80% calculation 1/3 onward. This week's daily estimated values (older dailys in prior EOD posts in prior blog) for next share issue:
02/18: 20 lowest intra-day VWAPs in 40 days avg, $0.0973, x 80%: $0.0778
02/19: 20 lowest intra-day VWAPs in 40 days avg, $0.0971, x 80%: $0.0777
Vol in K, for above days: 879.23 1885.45.
Week ending summaries of PIPE financing estimated 85% share pricing, "Dly Sht % of 'sells'", and inflection points here are in the latest daily post above.
02/18/2014: EOD stuff partially copied to the concentrator.
# Trds: 82, MinTrSz: 246, MaxTrSz: 99000, Vol: 879226, AvTrSz: 10722
Min. Pr: 0.0975, Max Pr: 0.1010, VW Avg. Tr. Pr: 0.0999
# Buys, Shares: 30 298538, VW Avg Buy Pr: 0.1004
# Sells, Shares: 52 580688, VW Avg Sell Pr: 0.0996
# Unkn, Shares: 0 0, VW Avg Unk. Pr: 0.0000
Buy:Sell 1:1.95 (33.95% "buys"), DlyShts 260308 (29.61%), Dly Sht % of 'sells' 44.83%
The average of the lowest 20 VWAPs times 80% today is $0.0778 vs. $0.0779, $0.0779, $0.0779, $0.0779, $0.0779, $0.0779, $0.0779, $0.0779 and $0.0779 on prior days. 80% of today's VWAP is $0.0799 vs. $0.0816, $0.0846, $0.0836 $0.0881, $0.0902, $0.0922, $0.0899, $0.0930 and $0.0873 on prior days. These are potential prices for the next tranche of shares to the PIPErs.
Today's low, high, VWAP, trade volume, and daily short sales moved -2.50%, -5.08%, -2.08%, -56.18% and -39.37% respectively. Price spread today was 3.59% vs. 6.40%, 9.52%, 3.49%, 16.06%, 17.07%, 9.90%, 10.60%, 10.71% and 16.86% on prior days.
We had two notable trades that were out of trend: 1500 and 1300 share trades at the open for $0.0975 each. Without these two trades our low would've been $0.098, which had other trades at and near the range, making them a more "reasonable" low. If we used this for the low, our low movement for the day would be down -2.00% instead of the -2.50% we got and the price spread would be 3.06% instead of 3.59%.
Larger trades (>= 15K) occurred on 19.51%, 16, of the 82 trades today. These totaled 517,676 shares, 58.88% of days volume, traded at a VWAP $0.0999. 25%, 4, of these 16 were buys of 169K shares, 32.65% of the larger trades volume, that traded at a VWAP of $0.1006. 12 of the 16 trades, 75%, were sells of ~349K shares that traded at a VWAP of $0.0996.
There were two larger trades that were notable for being greater than 50K and included one buy of73,676 at $0.0990 and one sell for $0.1010 of 99K shares.
Yesterday I said with another down day on large volume, it's not looking good at all. Regarding the inverted cup and handle formation, I noted we closed below ~$0.1001 and if we confirm, we should see some price deterioration. We now have confirmation with a second close below that price. I suspected we'd get confirmation without the appearance of the ARCA "white knight" I mentioned that had "saved us" on 1/30 and 2/4.
Well, we got a "white" knight" in the form of a 300K bid at $0.10 at 15:33. Without this I believe our close would have been sub-$0.10. Thank you to the investor trading through CSTI market-maker for saving our bacon today. I believe this was a real investment, rather than what I thought might be ARCA manipulation on 1/30 and 2/4 because the bid was only a little above the best bid, $0.0999, at the time, unlike the $0.106 we got on 2/4 from ARCA which was way above the best bid of $0.103 at the time and just below the best offer of $0.1065 at the time. At that time, ARCA also exited the sell side one minute before that bid was entered by ARCA on the buy side. Today we had no such behavior - ARCA was in on the sell side all day.
On the traditional TA front, we have three days of lower highs and lows now. Stochastic sank deeper into oversold today and Williams %R is still on track to get there soon. RSI continues to weaken, now below neutral at ~45, but it's been below neutral since Thursday last. MFI and momentum continue to be hesitant about making a strong trend, flipping this way and that, but generally making a very gradual movement towards lower. ADX and related weakening is becoming slightly more pronounced.
A possible hopeful sign, albeit a weak one IMO given current conditions and past behavior, is that volume was lower today. Maybe we'll stabilize here for a day or two, but I'm not all that optimistic about that.
Two days now we've traded completely below my longer-term descending resistance (formerly support). Worse, we are separating from it as price descends faster than the line, ~$0.0028/week.
Recall that I think the best, and closest, chance for support remains my medium-term former descending resistance. Two days ago it was at ~$0.0927, AFAICT, and descending at ~$0.003/week. My longer-term descending former support, two days ago at ~$0.1065, should act as resistance to any attempt to move up. It descends about $0.0028/week.
There was an early indication we might substantially recover from yesterday's lousy 17.7% buy percentage. Through 10:56 we traded 144.645 shares as buys, thanks to a 99K buy at 9:55. We held up relatively well, maintaining a 92.98% buy percentage through the next hour ending at 10:56.
This also suggests that the daily short sales should end higher than might have been expected. It did as the 29.61% was higher than what I would've been expecting because I thought we were in another down leg. Something around or below yesterday's 21.4% is what I was thinking.
Regarding the short percentage, yesterday I said this almost assures lower price if it [the reducing short percentage] continues and that I thought we could expect lower percentages and prices over the next few days. We got the lower prices (note the percentage reductions in low, high and VWAP above), but we'll have to await the daily short sales trend to develop before we know what it's doing. Tomorrow ought to add some clue.
ARCA was not on the bid today.
ARCA was there at 09:32 and stayed in all day, being there at my last check at 15:58. They weren't all that aggressive today, entering at $0.102 and only going to $0.10 by 09:57 even with some competition from ATDF and CDEL. The offer managed to hold right in that area for the rest of the day, going no lower than $0.0999.
This was helped by the late entry of our "white knight" trading through CSTI. I suspect that the remainder of that 300K share order at $0.10 might start our day of with decent support - we'll see if it''s there and if it helps out. Should be around 100K or so left on it if it was a GTC order.
Regarding my original inflection point calculations, one day changes continued yesterday's all periods strengthening, although still very small changes. Change over five days has improved from four periods weaker to five periods improving, in small to medium degrees, while the rates of change for five periods suggest reducing rates of weakening.
The newer version agrees in that all periods improved over one day, giving four out of five days showing improvement, generally. The aggregate change over five days shows all periods improving, as does rate of change. All are small changes thus far.
Here's a trading breakdown by arbitrary time-frames.
09:30-09:30: 002800 shrs, 00.32% of vol, VWAP $0.0975, 000.0% buys
09:55-10:04: 128250 shrs, 14.59% of vol, VWAP $0.1008, 100.0% buys
10:06-13:00: 096176 shrs, 10.94% of vol, VWAP $0.0994, 031.3% buys
13:13-14:51: 203000 shrs, 23.09% of vol, VWAP $0.0991, 007.4% buys
15:00-15:32: 093000 shrs, 10.58% of vol, VWAP $0.1000, 074.2% buys
15:33-16:01: 356000 shrs, 40.49% of vol, VWAP $0.1001, 015.8% buys
Here's a breakdown by arbitrary price range.
$0.0975-$0.0975: 002800 shrs, 00.32% of vol, VWAP $0.0975, 000.0% buys
$0.0980-$0.0981: 025300 shrs, 02.88% of vol, VWAP $0.0981, 000.0% buys
$0.0990-$0.0999: 273346 shrs, 31.09% of vol, VWAP $0.0993, 005.7% buys
$0.1000-$0.1000: 444299 shrs, 50.53% of vol, VWAP $0.1000, 033.6% buys
$0.1001-$0.1010: 133481 shrs, 15.18% of vol, VWAP $0.1009, 100.0% buys
Some day-to-day VWAP changes, with the end date shown and the percentage change from the prior day. Buy percentage is the last value on each line.
01/27 $0.0925 -02.34% 35.6%
01/28 $0.0908 -01.82% 17.5%
01/29 $0.0914 +00.60% 30.2%
01/30 $0.0946 +03.55% 09.6%
01/31 $0.0997 +05.33% 53.9%
02/03 $0.1038 +04.14% 55.6%
02/04 $0.1092 +05.16% 40.5%
02/05 $0.1163 +06.52% 39.6%
02/06 $0.1124 -03.33% 41.7%
02/07 $0.1153 +02.56% 36.8%
02/10 $0.1128 -02.17% 26.6%
02/11 $0.1101 -02.35% 24.2%
02/12 $0.1046 -05.05% 46.6%
02/13 $0.1057 +01.12% 45.1%
02/14 $0.1020 -03.55% 17.7%
02/18 $0.0999 -02.08% 34.0%
Using the new 80% calculation 1/3 onward. This week's daily estimated values (older dailys in prior EOD posts in prior blog) for next share issue:
02/18: 20 lowest intra-day VWAPs in 40 days avg, $0.0973, x 80%: $0.0778
Vol in K, for above days: 879.23.
Week ending summaries of PIPE financing estimated 85% share pricing, "Dly Sht % of 'sells'", and inflection points here are are in the latest daily post above.
02/14/2014: EOD stuff partially copied to the concentrator.
# Trds: 101, MinTrSz: 5, MaxTrSz: 180000, Vol: 2006349, AvTrSz: 19865
Min. Pr: 0.1000, Max Pr: 0.1064, VW Avg. Tr. Pr: 0.1020
# Buys, Shares: 26 355830, VW Avg Buy Pr: 0.1025
# Sells, Shares: 71 1573319, VW Avg Sell Pr: 0.1018
# Unkn, Shares: 4 77200, VW Avg Unk. Pr: 0.1028
Buy:Sell 1:4.42 (17.74% "buys"), DlyShts 429269 (21.40%), Dly Sht % of 'sells' 27.28%
The average of the lowest 20 VWAPs times 80% today is $0.0779 vs. $0.0779, $0.0779, $0.0779, $0.0779, $0.0779, $0.0779, $0.0779, $0.0779 and $0.0779 on prior days. 80% of today's VWAP is $0.0816 vs. $0.0846, $0.0836 $0.0881, $0.0902, $0.0922, $0.0899, $0.0930, $0.0873 and $0.0830 on prior days. These are potential prices for the next tranche of shares to the PIPErs.
Today's low, high, VWAP, trade volume, and daily short sales moved -3.85%, -6.58%, -3.55%, 6.71% and -16.41% respectively. Price spread today was 6.40% vs. 9.52%, 3.49%, 16.06%, 17.07%, 9.90%, 10.60%, 10.71%, 16.86% and 18.88% on prior days.
Larger trades (>= 15K) occurred on 32 of the day's 101 trades, 31.68%. These totaled ~1.495.4MM shares, 74.53% of days volume, traded at a VWAP $0.1022. 4 of these 32, 12.50%, were buys of ~209.4K shares, 14.00% of the larger trades volume, that traded at a VWAP of $0.1026. 27 trades, 84.38%, were sells of 1.236MM shares, 82.66% of the larger trades volume, that traded at a VWAP of $0.1020. One trade of 50K at $0.1041 was an "unknown", but I suspect it was a sell.
There were quite a few larger trades that were notable for being greater than 50K and included one buy of 118K at $0.1020 and sells of 60K at $0.1000, 61.2K at $0.1030, 73K at $0.1020, 85.9K at $0.1040, 100K at $0.1003, 100K at $0.1041, 126K at $0.1040 and 180K at $0.1000.
Yesterday discussing the weakening I had been noting, I dismissed my "something positive, even if it's only minor and temporary. Today higher low, high and VWAP on rising volume!" with "... we closed lower and in traditional TA a lower close on higher volume is not good news! I went on to mention several other TA factors that suggested further weakening was likely.
Now with another down day on large volume, it's not looking good at all.
Stochastic entered oversold yesterday and Williams %R is still on track to get there soon.
I mentioned the potential for an inverted cup and handle formation, said it looked like a handle was forming, and said if we close below ~$0.1001 and confirm, we should see some price deterioration. We closed below that price and now await confirmation. I suspect we'll get confirmation without the appearance of the ARCA "white knight" I mentioned that had "saved us" on 1/30 and 2/4.
The best, and closest, chance for support remains my medium-term former descending resistance. Yesterday it was at ~$0.0927, AFAICT, and is descending ~$0.003/week. My longer-term descending former support, currently ~$0.1065, should act as resistance to any attempt to move up. It descends about $0.0028/week.
In contrast to yesterday's buy percentage, which was pretty good again at 45.1% on higher volume, today's was abysmal at 17.7% on even higher volume. I had mentioned the buy percentage was likely just the normal effects of falling price enticing some buyers and the MMs shorting (yesterday a lower, but still relatively decent, 27.31%) into that demand. Today seems to confirm that assessment.
Regarding the short percentage, yesterday I said still nothing decided - don't know if we're reverting to more normal short behavior, starting a new leg or what. Today suggests that it's a new leg, and down. This almost assures lower price if it continues. Recent readings, oldest to latest: 19.47%, 25.05%, 32.53%, 27.31% and 21.40%. When one looks at the trade volumes and shorts over the last few days I think we can expect lower percentages and prices over the next few days.
ARCA was not on the bid today.
ARCA played no peek-a-boo today. They entered at 10:09 and hung around until 15:54. There initial offer, $0.104, was only slightly lower than the $0.1049 at the time. By 12:09 ARCA was at $0.102 but NITE bested them with a $0.1015 offer. By 12:01 ARCA was at $0.101 and at 13:07 $0.1009. Movement slowed thereafter and by 15:16 ARCA and NITE shared a best offer of $0.102. Other than NITE I didn't see other MMs strongly contesting the top spot.
Regarding my original inflection point calculations, One day changes have switched from yesterday's minuscule weakening in five of the periods to all six periods weakening in larger magnitude, although still not "large" changes. Change over five days has four periods weaker, in small to medium degrees, while the rates of change for all periods suggest reducing rates of weakening with all six periods having small positive changes. Still nothing new or changed, really.
The newer version, due to considering additional factors, disagrees in that all periods deteriorated over one day, after improving for three days. The aggregate change over five days has five periods weakening, as does rate of change. All are small changes thus far.
Here's a trading breakdown by arbitrary time-frames. Note some time overlaps because I wanted to catch important price breaks with a bit more resolution.
09:30-09:30: 027555 shrs, 01.37% of vol, VWAP $0.1042, 087.5% buys
09:30-09:30: 026125 shrs, 01.30% of vol, VWAP $0.1053, 086.8% buys
09:37-10:09: 562569 shrs, 28.04% of vol, VWAP $0.1040, 011.2% buys
10:12-12:04: 217695 shrs, 10.85% of vol, VWAP $0.1030, 012.8% buys
12:06-12:07: 152000 shrs, 07.58% of vol, VWAP $0.1022, 000.0% buys
12:07-12:14: 085000 shrs, 04.24% of vol, VWAP $0.1008, 020.3% buys
12:14-12:14: 118000 shrs, 05.88% of vol, VWAP $0.1020, 100.0% buys
12:19-15:54: 485205 shrs, 24.18% of vol, VWAP $0.1004, 017.1% buys
15:55-15:59: 332200 shrs, 16.56% of vol, VWAP $0.1000, 000.0% buys
Here's a breakdown by arbitrary price range.
$0.1000-$0.1000: 332200 shrs, 16.56% of vol, VWAP $0.1000, 000.0% buys
$0.1001-$0.1009: 485205 shrs, 24.18% of vol, VWAP $0.1004, 013.0% buys
$0.1010-$0.1011: 085000 shrs, 04.24% of vol, VWAP $0.1010, 043.8% buys
$0.1020-$0.1025: 295000 shrs, 14.70% of vol, VWAP $0.1021, 040.0% buys
$0.1030-$0.1031: 214900 shrs, 10.71% of vol, VWAP $0.1030, 011.6% buys
$0.1040-$0.1049: 578714 shrs, 28.84% of vol, VWAP $0.1041, 016.8% buys
$0.1050-$0.1064: 015330 shrs, 00.76% of vol, VWAP $0.1056, 100.0% buys
Some day-to-day VWAP changes, with the end date shown and the percentage change from the prior day. Buy percentage is the last value on each line.
01/24 $0.0947 +01.08% 24.0%
01/27 $0.0925 -02.34% 35.6%
01/28 $0.0908 -01.82% 17.5%
01/29 $0.0914 +00.60% 30.2%
01/30 $0.0946 +03.55% 09.6%
01/31 $0.0997 +05.33% 53.9%
02/03 $0.1038 +04.14% 55.6%
02/04 $0.1092 +05.16% 40.5%
02/05 $0.1163 +06.52% 39.6%
02/06 $0.1124 -03.33% 41.7%
02/07 $0.1153 +02.56% 36.8%
02/10 $0.1128 -02.17% 26.6%
02/11 $0.1101 -02.35% 24.2%
02/12 $0.1046 -05.05% 46.6%
02/13 $0.1057 +01.12% 45.1%
02/14 $0.1020 -03.55% 17.7%
Using the new 80% calculation 1/3 onward. This week's daily estimated values (older dailys in prior EOD posts in prior blog) for next share issue:
02/10: 20 lowest intra-day VWAPs in 40 days avg, $0.0973, x 80%: $0.0779
02/11: 20 lowest intra-day VWAPs in 40 days avg, $0.0973, x 80%: $0.0779
02/12: 20 lowest intra-day VWAPs in 40 days avg, $0.0973, x 80%: $0.0779
02/13: 20 lowest intra-day VWAPs in 40 days avg, $0.0973, x 80%: $0.0779
02/14: 20 lowest intra-day VWAPs in 40 days avg, $0.0973, x 80%: $0.0779
Vol in K, for above days: 798.30 1,805.49 252.10 1880.12 2006.35.
Week ending summaries of PIPE financing estimated 85% share pricing, "Dly Sht % of 'sells'", and inflection points here are in the latest daily post above.
02/13/2014: EOD stuff partially copied to the concentrator.
# Trds: 163, MinTrSz: 100, MaxTrSz: 108000, Vol: 1880123, AvTrSz: 11534
Min. Pr: 0.1040, Max Pr: 0.1139, VW Avg. Tr. Pr: 0.1057
# Buys, Shares: 67 847151, VW Avg Buy Pr: 0.1065
# Sells, Shares: 95 1023972, VW Avg Sell Pr: 0.1051
# Unkn, Shares: 1 9000, VW Avg Unk. Pr: 0.1070
Buy:Sell 1:1.21 (45.06% "buys"), DlyShts 513540 (27.31%), Dly Sht % of 'sells' 50.15%
The average of the lowest 20 VWAPs times 80% today is $0.0779 vs. $0.0779, $0.0779, $0.0779, $0.0779, $0.0779, $0.0779, $0.0779, $0.0779 and $0.0779 on prior days. 80% of today's VWAP is $0.0846 vs. $0.0836 $0.0881, $0.0902, $0.0922, $0.0899, $0.0930, $0.0873, $0.0830 and $0.0797 on prior days. These are potential prices for the next tranche of shares to the PIPErs.
Today's low, high, VWAP, trade volume, and daily short sales moved 0.87%, 6.75%, 1.12%, 645.78% and 526.27% respectively. Price spread today was 9.52% vs. 3.49%, 16.06%, 17.07%, 9.90%, 10.60%, 10.71%, 16.86%, 18.88% and 22.83% on prior days.
Larger trades (>= 15K) occurred on 31 of the day's 163 trades, 19.02%. These totaled 1,054,500 shares, 56.09% of days volume, traded at a VWAP $0.1057. 11 of these 31, 35.48%, were buys of 506,400 shares, 48.02% of the larger trades volume, that traded at a VWAP of $0.1065. 20 trades, 64.52%, were sells of 548,100 shares, 51.98% of the larger trades volume, that traded at a VWAP of $0.1050. Unusually, the buys and sells of these larger blocks were pretty well balanced. I suspect JP's double count due to MMs was at play here.
Discussing the weakening yesterday, I said it adds to my bearish view as VWAP continues to decline, and other things I mentioned. At last I can say something positive, even if it's only minor and temporary. Today higher low, high and VWAP on rising volume!
Enough of that - we closed lower and in traditional TA a lower close on higher volume is not good news! And that leads me into the traditional TA ...
We closed below our open of $0.1045 and the prior close of $0.1045. Again today we closed below my descending longer-term resistance and our low, at $0.1040, was barely off the 50-day SMA of $0.1039. We still have a weakening MACD with a histogram barely above zero and rapidly falling with the signal about to go below the average. Essentially, the oscillators I watch are like yesterday, trending down, but a bit worse, with little flip here and there: full stochastic (worse - now into oversold); RSI weakens more; ADX and related have a little flip up; accumulation and distribution weakened more; MFI a flip up; Williams %R and momentum now descending.
Yesterday I said I expect full stochastic and Williams %R will enter oversold in a couple of days if things don't change. Stochastic did it today.
I mentioned yesterday the potential for an inverted cup and handle formation. It looks like a handle is forming. If we close below ~$0.1001 and confirm, we should see some price deterioration. I would not be surprised by a low $0.09xx or even a high $0.08xx if ARCA or some other white knight doesn't jump in as was done on 1/30 and 2/4.
I had mentioned recently that best chance for support seems to be my medium-term former descending resistance. It's currently at ~$0.0927 AFAICT, but it is descending so when we test ti will be important if we do start down. It looks like it drops ~$0.003/week.
Moving to less traditional considerations ...
Today's buy percentage was pretty good again and on higher volume. I'd noted yesterdays 46.6% was the highest since 1/31's 53.9% and 2/3's 55.6%. If it wasn't for the abysmal volume and higher buy percentage, which is common on lower prices, I would've seen it as a positive. Recall those two days had the benefit of ~2.6MM and ~2.99MM shares traded on the upswing in VWAP, courtesy of the ARCA "intervention" on 1/30 and later 2/4. Today we have volume but no upswing! Well, maybe we could count +$0.0011 higher VWAP as an upswing? Or we could ignore the close lower than the prior close and lower than the open and count the higher low and high as an upswing?
That would be stretching it folks!
The buy percentage was again likely just the normal effects of falling price enticing some buyers and the MMs shorting (a lower, but still relatively decent, 27.31%) into that demand.
Regarding the short percentage, still nothing decided - don't know if we're reverting to more normal short behavior, starting a new leg or what.
ARCA was not on the bid today.
ARCA played peek-a-boo again all day long. They were not as aggressive undercutting the offers, likely because they could see some of those 100K and 200K bids laying around and they could see the buyers were stepping forward a bit again.
Regarding my original inflection point calculations, it's tiring watching and reporting these minuscule changes that mean nothing but volatility is in the house. Oh well ... One day changes have minuscule weakening in five of the periods. Change over five days has all periods weaker along with the rates of change for all periods. Nothing new or changed, really.
The newer version of the experimental calculations are in contrast, partly, in that all periods improved for the third consecutive day over one day. The same is true for the aggregate change over five days and rate of change. All improvements are still very small but may add up if they continue long enough.
Here's a trading breakdown by arbitrary time-frames.
09:30-09:59: 061775 shrs, 03.29% of vol, VWAP $0.1046, 047.8% buys
10:01-10:27: 073200 shrs, 03.89% of vol, VWAP $0.1056, 071.7% buys
10:30-11:02: 213150 shrs, 11.34% of vol, VWAP $0.1077, 056.9% buys
11:10-11:23: 052800 shrs, 02.81% of vol, VWAP $0.1068, 018.2% buys
11:36-11:46: 093300 shrs, 04.96% of vol, VWAP $0.1084, 022.9% buys
11:49-12:47: 232912 shrs, 12.39% of vol, VWAP $0.1068, 068.3% buys
12:50-13:00: 084925 shrs, 04.52% of vol, VWAP $0.1064, 020.6% buys
13:01-13:28: 136500 shrs, 07.26% of vol, VWAP $0.1051, 066.3% buys
13:59-14:23: 092000 shrs, 04.89% of vol, VWAP $0.1048, 013.0% buys
14:30-14:31: 079000 shrs, 04.20% of vol, VWAP $0.1084, 100.0% buys
14:31-15:01: 470700 shrs, 25.04% of vol, VWAP $0.1044, 039.0% buys
15:03-15:30: 076100 shrs, 04.05% of vol, VWAP $0.1043, 005.9% buys
15:37-15:54: 213761 shrs, 11.37% of vol, VWAP $0.1045, 031.2% buys
Here's a breakdown by arbitrary price range.
$0.1040-$0.1049: 750275 shrs, 39.91% of vol, VWAP $0.1043, 016.5% buys
$0.1050-$0.1059: 369286 shrs, 19.64% of vol, VWAP $0.1052, 076.8% buys
$0.1060-$0.1063: 253512 shrs, 13.48% of vol, VWAP $0.1061, 012.6% buys
$0.1070-$0.1071: 245900 shrs, 13.08% of vol, VWAP $0.1070, 074.8% buys
$0.1080-$0.1084: 137750 shrs, 07.33% of vol, VWAP $0.1082, 100.0% buys
$0.1090-$0.1099: 085000 shrs, 04.52% of vol, VWAP $0.1098, 100.0% buys
$0.1100-$0.1139: 038400 shrs, 02.04% of vol, VWAP $0.1101, 002.6% buys
Some day-to-day VWAP changes, with the end date shown and the percentage change from the prior day. Buy percentage is the last value on each line.
01/23 $0.0937 -06.05% 27.6%
01/24 $0.0947 +01.08% 24.0%
01/27 $0.0925 -02.34% 35.6%
01/28 $0.0908 -01.82% 17.5%
01/29 $0.0914 +00.60% 30.2%
01/30 $0.0946 +03.55% 09.6%
01/31 $0.0997 +05.33% 53.9%
02/03 $0.1038 +04.14% 55.6%
02/04 $0.1092 +05.16% 40.5%
02/05 $0.1163 +06.52% 39.6%
02/06 $0.1124 -03.33% 41.7%
02/07 $0.1153 +02.56% 36.8%
02/10 $0.1128 -02.17% 26.6%
02/11 $0.1101 -02.35% 24.2%
02/12 $0.1046 -05.05% 46.6%
02/13 $0.1057 +01.12% 45.1%
Using the new 80% calculation 1/3 onward. This week's daily estimated values (older dailys in prior EOD posts in prior blog) for next share issue:
02/10: 20 lowest intra-day VWAPs in 40 days avg, $0.0973, x 80%: $0.0779
02/11: 20 lowest intra-day VWAPs in 40 days avg, $0.0973, x 80%: $0.0779
02/12: 20 lowest intra-day VWAPs in 40 days avg, $0.0973, x 80%: $0.0779
02/13: 20 lowest intra-day VWAPs in 40 days avg, $0.0973, x 80%: $0.0779
Vol in K, for above days: 798.30 1,805.49 252.10 1880.12.
Week ending summaries of PIPE financing estimated 85% share pricing, "Dly Sht % of 'sells'", and inflection points here are in the latestdaily post above.
02/12/2014: EOD stuff partially copied to the concentrator.
# Trds: 46, MinTrSz: 100, MaxTrSz: 25000, Vol: 252101, AvTrSz: 5480
Min. Pr: 0.1031, Max Pr: 0.1067, VW Avg. Tr. Pr: 0.1046
# Buys, Shares: 20 117506, VW Avg Buy Pr: 0.1053
# Sells, Shares: 26 134595, VW Avg Sell Pr: 0.1039
# Unkn, Shares: 0 0, VW Avg Unk. Pr: 0.0000
Buy:Sell 1:1.15 (46.61% "buys"), DlyShts 82000 (32.53%), Dly Sht % of 'sells' 60.92%
Dollar volume traded today was $26,359.98.
The average of the lowest 20 VWAPs times 80% today is $0.0779 vs. $0.0779, $0.0779, $0.0779, $0.0779, $0.0779, $0.0779, $0.0779, $0.0779 and $0.0780 on prior days. 80% of today's VWAP is $0.0836 vs. $0.0881, $0.0902, $0.0922, $0.0899, $0.0930, $0.0873, $0.0830, $0.0797 and $0.0757 on prior days. These are potential prices for the next tranche of shares to the PIPErs.
Today's low, high, VWAP, trade volume, and daily short sales moved 0.98%, -9.96%, -5.05%, -86.04% and -81.87% respectively. Price spread today was 3.49% vs. 16.06%, 17.07%, 9.90%, 10.60%, 10.71%, 16.86%, 18.88%, 22.83% and 8.69% on prior days.
Only two "larger" trades today: 15K shares @ $0.1031 and 25K shares @ $0.1067.
Discussing the weakening yesterday, I mentioned the three consecutive reductions in buy percentage and VWAP and noted that when combined with the day's strong rise in volume, a sign of the strength of the move, a lower low and lower high, I felt the weakening was confirmed. Today adds to my bearish view as VWAP continues to decline. Here's VWAP 1/28 forward (recall ARCA first came on the bid 1/30, saving our bacon when it looked like we might go sub-$0.09 shortly): $0.0908, $0.0914, $0.0946, $0.0997, $0.1038, $0.1092, $0.1163, $0.1124, $0.1153, $0.1128, $0.1101 and $0.1046. If you visualize this you can see the rounding top I noted some days back. The $0.1092 was ARCA's second time on the bid with the $0.106 bid on 2/4, soaking up a bunch of shares (couple hundred K?), apparently, at that price.
I'd try to take solace in the buy percentage today, the highest since 1/31's 53.9% and 2/3's 55.6%, if it wasn't for the abysmal volume and higher buy percentage, which is common on lower prices. Those two days had the benefit of ~2.6MM and ~2.99MM shares traded on the upswing in VWAP, courtesy of the ARCA "intervention" on 1/30 and later 2/4. Here's the VWAPs for just 1/30 - 2/4: $0.0946, $0.0997, $0.1038 and $0.1092. BTW, 2/4 had ~2.17MM shares volume with 40.5% buys.
The buy percentage was likely just the normal effects of falling price enticing some buyers and the MMs shorting into that demand on a low-volume, low-risk day. Daily short percentage moved up over these last three days from ~19.5% to ~32.5% - normal cyclic behavior - nothing to see here, move along.
Anybody else smell this rat now that VWAPs made the move I described above? On what catalyst? The new board member? Ha! If so, the effect was certainly ephemeral.
On the traditional TA front, I yesterday said a rounding pattern confirmed and it's likely the start of a strong move lower would appear as we went from up on weak volume to down on strong volume. Today we: traded completely below my longer-term descending resistance after five consecutive days in which it seemed to be providing support, although I noted yesterday we closed below it for the first time and I was looking for confirmation which appeared today; have a narrow spread (3.49% is very narrow compared to our recent normal - see the recounting above); have weak volume, a sign of indecision and weakness; have a weakening MACD with a histogram barely above zero and rapidly falling and the signal about to go below the average; full stochastic, RSI, ADX and related, accumulation and distribution and MFI all continue weakening and I now believe it's a trend rather than just volatility in play; Williams %R and momentum have transitioned from just "ticks" up and down to starting a descending trend as well.
Four days back I said I expect a little volatility over the next few days with generally increasing spreads and the development of a downward bias in price. So far it's played out that way. Today should end that trend and (possibly pause?) start a new one. I expect full stochastic and Williams %R will enter oversold in a couple of days if things don't change.
Although it's very short-term, we have in place an inverted cup and may go on to form a bearish (inverted) cup and handle. These are normally longer-term patterns but I've found that very short-term ones also seem to work fairly well at predicting a near-term (weak?) move down.
I had mentioned yesterday the daily short behavior offered the possibility we're at, or very near, the bottom of this leg. If so, it's a higher bottom than normally seen recently. Today it bounced up but with the low volume and high buy percentage combination I don't know whether to consider this the start of another leg up or just a normal blip on the way to lower percentages. I've also wondered if we may be returning to a more normal daily short sales profile with fewer and less-radical swings. Today's, and recent, action leaves the possibility of either a leg bottom or return to more normal behavior still on the table and adds the possibility of another leg up - although if buy percentage doesn't remain high, which I do not expect, a percentage leg up seems unlikely sans good volume.
ARCA was not on the bid today.
ARCA popped in and out of the sell side a couple times today but entered only marginally lowered offers and didn't stay long. They twice exited after around 15 minutes and stayed only an hour the other time. No major tussling went on any of the three times.
Regarding my original inflection point calculations, yesterday the one-day changes had five weakening periods and the five-day period slightly strengthening. The aggregate change over five days was split three weaker and three less weak. The rate of change had two weaker and four less weak. Today, because of the low volume, I wouldn't place much importance on the readings, which include one-day changes with all periods improving, aggregate five-day changes with five improved and one weaker and the rate of change over five days the same. Not big changes in any of the readings.
On the chart the bearish slant is abating a bit as things begin to flatten out some.
The newer version of the experimental calculations have all periods improved for the second consecutive day over one day, along with all periods in the aggregate change over five days and rate of change. But all these improvements are very small and, when combined with low volume, should have little import. They're so small that only the change in the five day towards flattening can be detected on the charts.
Here's a trading breakdown by arbitrary time-frames.
09:30-09:39: 616610 shrs, 75.76% of vol, VWAP $0.4229, 009.3% buys
09:49-10:11: 035923 shrs, 04.41% of vol, VWAP $0.1033, 000.0% buys
10:26-11:07: 044400 shrs, 05.46% of vol, VWAP $0.1042, 051.8% buys
11:31-11:57: 039000 shrs, 04.79% of vol, VWAP $0.1045, 070.5% buys
12:20-14:07: 035222 shrs, 04.33% of vol, VWAP $0.1044, 050.3% buys
14:15-15:56: 042775 shrs, 05.26% of vol, VWAP $0.1044, 044.4% buys
Here's a breakdown by arbitrary price range.
$0.1031-$0.1038: 080420 shrs, 31.90% of vol, VWAP $0.1036, 006.2% buys
$0.1040-$0.1045: 049400 shrs, 19.60% of vol, VWAP $0.1041, 029.8% buys
$0.1050-$0.1050: 092000 shrs, 36.49% of vol, VWAP $0.1050, 073.4% buys
$0.1066-$0.1067: 030281 shrs, 12.01% of vol, VWAP $0.1067, 100.0% buys
Some day-to-day VWAP changes, with the end date shown and the percentage change from the prior day. Buy percentage is the last value on each line.
01/22 $0.0998 +00.10% 30.0%
01/23 $0.0937 -06.05% 27.6%
01/24 $0.0947 +01.08% 24.0%
01/27 $0.0925 -02.34% 35.6%
01/28 $0.0908 -01.82% 17.5%
01/29 $0.0914 +00.60% 30.2%
01/30 $0.0946 +03.55% 09.6%
01/31 $0.0997 +05.33% 53.9%
02/03 $0.1038 +04.14% 55.6%
02/04 $0.1092 +05.16% 40.5%
02/05 $0.1163 +06.52% 39.6%
02/06 $0.1124 -03.33% 41.7%
02/07 $0.1153 +02.56% 36.8%
02/10 $0.1128 -02.17% 26.6%
02/11 $0.1101 -02.35% 24.2%
02/12 $0.1046 -05.05% 46.6%
Using the new 80% calculation 1/3 onward. This week's daily estimated values (older dailys in prior EOD posts in prior blog) for next share issue:
02/10: 20 lowest intra-day VWAPs in 40 days avg, $0.0973, x 80%: $0.0779
02/11: 20 lowest intra-day VWAPs in 40 days avg, $0.0973, x 80%: $0.0779
02/12: 20 lowest intra-day VWAPs in 40 days avg, $0.0973, x 80%: $0.0779
Vol in K, for above days: 798.30 1,805.49 252.10.
Week ending summaries of PIPE financing estimated 85% share pricing, "Dly Sht % of 'sells'", and inflection points here are in the latest daily post above.
02/11/2014: EOD stuff partially copied to the concentrator.
# Trds: 170, MinTrSz: 5, MaxTrSz: 85000, Vol: 1805486, AvTrSz: 10621
Min. Pr: 0.1021, Max Pr: 0.1185, VW Avg. Tr. Pr: 0.1101
# Buys, Shares: 68 437264, VW Avg Buy Pr: 0.1086
# Sells, Shares: 100 1322722, VW Avg Sell Pr: 0.1105
# Unkn, Shares: 2 45500, VW Avg Unk. Pr: 0.1142
Buy:Sell 1:3.02 (24.22% "buys"), DlyShts 452259 (25.05%), Dly Sht % of 'sells' 34.19%
FINRA rules don't allow "out of channel" trades to be shown as the lowest (or highest?) trade of the normal trading session - specifically in this case a $0.1021 "average" price trade of 67.5K at 13:38:42. Therefore, all reporting services you might normally use would show the day's low as $0.1022 if they didn't round to the nearest penny. Power ETrade Pro daily charts don't round and does show $0.1022 as the low. The ADVFN historical screen also maintains the fractional pennies and shows $0.1022.
Rounded values would show $0.10 for the low, as well as $0.12 for the high when it was really $0.1185. Precision doesn't seem to be of much value in the financial industry, from what I can see on this and other reporting issues. If you check the values at the end of the day on the normal summary screens from these various services the fractional pennies are usually available.
The average of the lowest 20 VWAPs times 80% today is $0.0779 vs. $0.0779, $0.0779, $0.0779, $0.0779, $0.0779, $0.0779, $0.0779, $0.0780 and $0.0783 on prior days. 80% of today's VWAP is $0.0881 vs. $0.0902, $0.0922, $0.0899, $0.0930, $0.0873, $0.0830, $0.0797, $0.0757 and $0.0731 on prior days. These are potential prices for the next tranche of shares to the PIPErs.
Today's low, high, VWAP, trade volume, and daily short sales moved -0.39%, -1.25%, -2.35%, 126.17% and 191.04% respectively. Price spread today was 16.06% vs. 17.07%, 9.90%, 10.60%, 10.71%, 16.86%, 18.88%, 22.83%, 8.69% and 10.25% on prior days.
The exorbitant intra-day price spread warrants no examination of the effects of the extremes because the lows and highs had other trades near those extremes, e.g. 67.2K at $0.1022-$0.1025 and 12,427 at $0.1181-$0.1182.
33 of 170 trades, 19.41%, were of size 15K or greater, constituting 51.09% of day's volume, or 922.5K shares at a VWAP of $0.1106 (above the day's $0.1101 VWAP). 30 of these 33, or 90.91%, were sells accounting for 847K shares at a VWAP of $0.1104. There were only 2 buys, 6.06% of these 33 trades, constituting 35K shares at a VWAP of $0.1116. One unknown trade for 40.5K at a price of $0.1140 completes the breakdown. Do keep in mind that one trade at an "average" price of $0.1021. You can calculate the effects of excluding it if it seems worthwhile, but the larger blocks have recently been common and "heavy" in effect so I think there's not much value in doing that.
The 137 trades smaller than 15K totaled ~883K shares with a VWAP of $0.1097 and an average trade size of 6,445, close to yesterday's 6,478. Sixty-six trades totaling ~402.3K, ~45.56% of the smaller block volume, were buys at a VWAP of $0.1083. Seventy trades totaling ~475.7K, 53.88% of the smaller block volume, were sells at a VWAP of $0.1107. There was one unknown for 5K at $0.1160.
In addition to the 67.5K "average" trade at $0.1021, here were a couple others of note: 65.5K at $0.1140 and 85K at $0.1160. With both near the middle of the day's range, I don't think examining excluding them and the other larger blocks (in the 40K - 50K range and also middle of day's range) would move much of anything but the average trade size and buy;sell, which would improve since all but one were sells. But no real benefit from checking that.
Continuing thoughts on the change from selling into strength to signs of weakness, we again see an $0.1101 VWAP down from yesterday's $0.1128, which was down from $0.1153, and a continued drop in the buy percentage, 24.2% vs. yesterday's 26.6% and the prior 36.8%. When combined with today's strong rise in volume, a sign of the strength of the move, a lower low and lower high today, I think the assessment of weakening is confirmed.
On the traditional TA front, yesterday I said the action seemed to confirm a reversal as we had lower volume, lower low and lower high in spite of having a green volume bar and candlestick because of the close being higher than yesterday's. I mentioned the distinct possibility of a rounding top forming.
Today confirms a rounding pattern, likely the start of a strong move lower as we went from up on weak volume to down on strong volume.
Today is the fifth day of trading in which my longer-term descending support (formerly resistance) seems to be providing support. We closed below it for the first time since getting above it. I think this is the proverbial "coiled spring" developing here. The possibility of a substantial drop looks ever more likely.
Three days back I said I expect a little volatility over the next few days with generally increasing spreads and the development of a downward bias in price. So far it's playing out just that way.
Full stochastic, RSI, ADX and related, accumulation and distribution and MFI all continue weakening. MFI has begun weakening. Williams %R and momentum are still just "ticks" up and down so far, with today being down ticks - no trend yet although the ticks up have lower amplitude while the down ticks have increasing amplitude. They are about to become a down trend IMO.
The MACD continues falling along with it's histogram.
The daily short percentage appears to continue following the normal pattern of vacillation in a down leg. Behavior offers the possibility were at, or very near, the bottom of this leg. If so, it's a higher bottom than normally seen recently. I mentioned yesterday a suggestion that we may be returning to a more normal daily short sales profile with fewer and less-radical swings. I was looking to Monday and Tuesday to offer a hint. The percentage didn't plummet, which would have suggested no change from recent behavior, but it also didn't move far from yesterday's 19.47%. This leaves the possibility of either a leg bottom or return to more normal behavior still on the table.
ARCA was on the bid today, but at a less outrageous deviation for the trading range and for a much shorter period. Entered at 09:34 with an $0.114 bid along with BKMM when ATDF had an $0.1141 bid. They did quickly move the bid up to $0.116 in two minuets, with no competition, and ATDF topped them with $0.1161 at 9:56. ARCA did not respond and exited at 10:14. Only 77.5K shares went at $0.116-$0.1161. During ARCA's presence, the offers remained mostly in the low $0.118x range, with a brief drop to $0.1172. Interestingly, my breakdown by time shows 373K traded 09:44-10:14 at a VWAP of $0.1160.
That's one heck of a coinkydink, no?
Here's another one - ARCA entered the sell side at 10:15, one minute after the buy side was vacated. Their offer? Why $0.116, natch! This substantially undercut the $0.1182 BTIG had in place at the top then. Makes me wonder if some shares were acquired on the buy side just so they could dump them on the sell side to lower pricing range. They were out a few minutes beginning at 10:43 and returned at 10:47 with another $0.116 offer undercutting the $0.1181 from ATDF. They stayed until 14:10 and during that time dropped to $0.11 in a bit over an hour as BTIG and ARCA tussled. At 12:05 offer had climbed back to $0.113 but was down to $0.1052 by 12:49. The usual up and down moves took place with most of it in the mid-to-high $0.10xx to low-$0.11 range until it dropped into the $0.103-$0.105 area 13:38-14:17.
ARCA left at 14:48 and offers moved immediately to $0.1079 and stayed in an area between that and $0.105 for the rest of the day.
How 'bout another coinkydink? On 2/4, when ARCA came on the bid at $0.106 and soaked up a bunch of shares, we had a similar but reversed timing. ARCA exited the sell side at 11:42, after having helped push the offers down as low as $0.1031, and ARCA entered the buy side with a $0.106 bid at 11:43. Let's see, how does this work exactly? You enter the sell side and push price down, scaring the bejeezus out of longs and then offer them what must seem god-send bid of $0.106. Now let price rise a couple days after you've sent this bullish signal and flip those shares for a nice couple-days profit of 10%-20% as you sell into strength, which I've been mentioning seems to be ending.
Regarding my original inflection point calculations I mentioned yesterday the changes over one day were essentially flat with minor changes up and down across various periods. The changes in aggregate over five days had five periods down and one with minor improvement. However, the rate of change weakened in all six periods. Today the one-day changes have five weakening periods and the five-day period slightly strengthening. The aggregate change over five days is split three weaker and three less weak. The rate of change has two weaker and four less weak.
On the chart all periods continue showing reducing readings - the bearish slant is gaining a bit of strength.
Of the newer version of the experimental calculations I had warned a couple days back "If this pattern strengthens, expect lower VWAPs to appear". One-day change with five periods with reducing weakening had morphed into all six periods weakening again and aggregate change over five days was clear on the charts with all periods weakening. Yesterday was a repeat with all periods weakening and the three longer periods having very large negative changes.
Today the one-day changes have all periods improved along with all periods in the aggregate change over five days. The large negative numbers move have dissipated as predicted and the rte of change metrics suggested. The rate of change is improved across the board as well.
But look at the charts! With this short-term volatility I wouldn't read much into the individual sets of numbers. We've lost almost all the gains made by the push up to the $0.12 range begun with ARCA's bid action 1/30 when it looked very likely we might go to $0.09 or below, and the more radical action when they were on the bid 2/4 at $0.106 (apparently) soaking up a couple hundred thousand shares at $0.106.
Regardless, with the volatility apparently still here, I wouldn't place wagers on any of this.
Here's a trading breakdown by arbitrary time-frames.
09:30-09:30: 003000 shrs, 00.17% of vol, VWAP $0.1146, 033.3% buys
09:44-10:14: 373000 shrs, 20.66% of vol, VWAP $0.1160, 003.0% buys
10:42-11:08: 033927 shrs, 01.88% of vol, VWAP $0.1164, 062.6% buys
11:29-11:51: 427100 shrs, 23.66% of vol, VWAP $0.1139, 006.3% buys
11:52-12:12: 201232 shrs, 11.15% of vol, VWAP $0.1084, 038.1% buys
12:26-12:45: 071000 shrs, 03.93% of vol, VWAP $0.1081, 085.9% buys
12:49-12:58: 129000 shrs, 07.14% of vol, VWAP $0.1051, 031.0% buys
12:59-13:13: 079000 shrs, 04.38% of vol, VWAP $0.1082, 074.7% buys
13:14-13:38: 111022 shrs, 06.15% of vol, VWAP $0.1057, 000.9% buys
13:38-13:44: 092500 shrs, 05.12% of vol, VWAP $0.1022, 000.0% buys
13:48-14:18: 085000 shrs, 04.71% of vol, VWAP $0.1032, 052.9% buys
14:22-14:34: 057200 shrs, 03.17% of vol, VWAP $0.1072, 094.4% buys
14:35-15:56: 142505 shrs, 07.89% of vol, VWAP $0.1048, 028.1% buys
Here's a breakdown by arbitrary price range.
$0.1021-$0.1025: 134700 shrs, 07.46% of vol, VWAP $0.1023, 000.0% buys
$0.1030-$0.1041: 066000 shrs, 03.66% of vol, VWAP $0.1036, 053.0% buys
$0.1050-$0.1059: 371527 shrs, 20.58% of vol, VWAP $0.1052, 025.6% buys
$0.1060-$0.1061: 077500 shrs, 04.29% of vol, VWAP $0.1060, 000.0% buys
$0.1070-$0.1079: 064000 shrs, 03.54% of vol, VWAP $0.1074, 084.4% buys
$0.1080-$0.1086: 118500 shrs, 06.56% of vol, VWAP $0.1080, 078.9% buys
$0.1090-$0.1099: 020000 shrs, 01.11% of vol, VWAP $0.1095, 100.0% buys
$0.1100-$0.1102: 106432 shrs, 05.89% of vol, VWAP $0.1100, 055.8% buys
$0.1119-$0.1128: 048000 shrs, 02.66% of vol, VWAP $0.1125, 031.3% buys
$0.1130-$0.1143: 363600 shrs, 20.14% of vol, VWAP $0.1139, 001.9% buys
$0.1150-$0.1162: 416800 shrs, 23.09% of vol, VWAP $0.1159, 009.6% buys
$0.1170-$0.1185: 018427 shrs, 01.02% of vol, VWAP $0.1178, 100.0% buys
Some day-to-day VWAP changes, with the end date shown and the percentage change from the prior day. Buy percentage is the last value on each line.
01/21 $0.0997 -00.75% 51.7%
01/22 $0.0998 +00.10% 30.0%
01/23 $0.0937 -06.05% 27.6%
01/24 $0.0947 +01.08% 24.0%
01/27 $0.0925 -02.34% 35.6%
01/28 $0.0908 -01.82% 17.5%
01/29 $0.0914 +00.60% 30.2%
01/30 $0.0946 +03.55% 09.6%
01/31 $0.0997 +05.33% 53.9%
02/03 $0.1038 +04.14% 55.6%
02/04 $0.1092 +05.16% 40.5%
02/05 $0.1163 +06.52% 39.6%
02/06 $0.1124 -03.33% 41.7%
02/07 $0.1153 +02.56% 36.8%
02/10 $0.1128 -02.17% 26.6%
02/11 $0.1101 -02.35% 24.2%
Using the new 80% calculation 1/3 onward. This week's daily estimated values (older dailys in prior EOD posts in prior blog) for next share issue:
02/10: 20 lowest intra-day VWAPs in 40 days avg, $0.0973, x 80%: $0.0779
02/11: 20 lowest intra-day VWAPs in 40 days avg, $0.0973, x 80%: $0.0779
Vol in K, for above days: 798.30 1,805.49.
Week ending summaries of PIPE financing estimated 85% share pricing, "Dly Sht % of 'sells'", and inflection points here are are in the latest daily post above.
02/10/2014: EOD stuff partially copied to the concentrator.
# Trds: 87, MinTrSz: 500, MaxTrSz: 73000, Vol: 798299, AvTrSz: 9176
Min. Pr: 0.1025, Max Pr: 0.1200, VW Avg. Tr. Pr: 0.1128
# Buys, Shares: 31 212549, VW Avg Buy Pr: 0.1135
# Sells, Shares: 56 585750, VW Avg Sell Pr: 0.1125
# Unkn, Shares: 0 0, VW Avg Unk. Pr: 0.0000
Buy:Sell 1:2.76 (26.63% "buys"), DlyShts 155395 (19.47%), Dly Sht % of 'sells' 26.53%
The average of the lowest 20 VWAPs times 80% today is $0.0779 vs. $0.0779, $0.0779, $0.0779, $0.0779, $0.0779, $0.0779, $0.0780, $0.0783 and $0.0787 on prior days. 80% of today's VWAP is $0.0902 vs. $0.0922, $0.0899, $0.0930, $0.0873, $0.0830, $0.0797, $0.0757, $0.0731 and $0.0727 on prior days. These are potential prices for the next tranche of shares to the PIPErs.
Today's low, high, VWAP, trade volume, and daily short sales moved -6.90%, -0.83%, -2.17%, -59.56% and -72.74% respectively. Price spread today was 17.07% vs. 9.90%, 10.60%, 10.71%, 16.86%, 18.88%, 22.83%, 8.69%, 10.25% and 1.43% on prior days.
The exorbitant intra-day price spread was caused by three trades. One occurred at the open for 20K shares at $0.1025. It was a "sell". Two others were the second and third trades of the day at 09:31:54 and 09:30:19, also "sells", for 20K and 10K at $0.12. Without these three trades, the low and high of the day would be $0.11 and $0.1194. That would make the change in the low and high -0.09% and -1.32% and the spread would be 8.55%.
9 of 87 trades, 10.34%, were of size 15K or greater, constituting 36.70% of day's volume, or 293K. 7 were sells totaling 257K shares, 87.71% of these larger trades, at a VWAP of $0.1123. The 2 buys totaled 36K shares, 12.29% of the larger trades, at a VWAP of $0.1136.
The trades smaller than 15K totaled 505,299 shares with a VWAP of $0.1130 and an average trade size of 6,478.
There were two exceptionally larger trades, 73K and 70K at $0.11 and $0.1150 respectively, that were "sells" that had noticeable effect on trade size and buy:sell ratio. Removing these two reduces average trade size to 7,709 from 9,176. VWAP would be unchanged though at $0.1128. The buy percentage would move to 32.44% from 26.6% and sell percentage would move to 67.56% from 73.4%. This is more in line with the various averages.
I've been talking about what I think was the start of a change from selling into strength to signs of weakness. We are still selling strongly, but now into what I believe will be increasing weakness. See yesterday's post for some values that lead me to this thought. Today seems to be continuing the trend I think is underway with a lower VWAP from yesterday's $0.1153, lower volume and lower buy percentage. We also have a low and high price that are lower. This holds whether we include or exclude the three trades of $0.1025 and $0.12 detailed above. We also have a lower average trade size even if we leave those two 70K+ trades in place. Without those two we fall right back to the recent normal range seen Tuesday through Thursday in the 7.5K-8.9K area, below the longer-term averages of 9,951, 9,669 and 9,104 for the 25, 50 and 100-day averages respectively.
The daily short percentage seems to be following the normal pattern of vacillation in a down leg. I mentioned yesterday a concern that a change may going on and I'm not sure if it's a temporary or more long-lived one. There's suggestion that we may be returning to a more normal daily short sales profile with fewer and less-radical swings. I'm looking to Monday and Tuesday to offer a hint. If the daily short percentage plummets, we know that a change is apparently not occurring.
On the traditional TA front, I've mentioned we had a high probability of a reversal and, yesterday, said it may be starting already. Today seems to confirm it as we have lower volume, lower low and lower high in spite of having a green volume bar and candlestick because of the close being higher than yesterday's. The pattern now raises the distinct possibility of a rounding top forming. Today is the fourth day of trading in which my longer-term descending support (formerly resistance) seems to be providing support. It looks to be ~$0.1085 today. If we break below it, and confirm, the possibility of a substantial drop arises. My intermediate-term descending support, currently ~$0.095, might be the best hope of the bottom of the move. But that would be contrary historical behavior.
Two days back I said I expect a little volatility over the next few days with generally increasing spreads and the development of a downward bias in price. Yesterday looked like the start of it and today it came in larger magnitude. I see it continuing another day or two, at least.
Full stochastic continues to drop after exiting overbought yesterday, after just one day in that condition, rather than staying in overbought for an extended period, as is common when strength is present. RSI, ADX and related, and accumulation and distribution continue weakening. MFI has begun weakening. Williams %R and momentum are still rising but they are just "ticks" up and down so far - no trend.
The MACD has ended the bullish move and is falling now and it's histogram continues to weaken now.
ARCA entered the sell side at 9:56 offering at $0.115, below the best offer of $0.1199 at the time. By 10:20 ARCA was offering at $0.1112 after NITE and BTIG tried to muscle in on ARCA's territory. ARCA took a breather at 11:29 and the offer rebounded to $0.1199 and $0.1195 for the eight minutes before ARCA returned at 11:37 with a $0.112 offer. They exited again at 11:43 but the offer only improved to $0.113 immediately and $0.1194 at 12:34. Too juicy? ARCA returned at 12:38 with a $0.115 offer. Competition started right away and the offer was down to $0.113 at 13:15. After that the others backed off a bit and we saw ARCA at $114 at 13:48. There it sat until ARCA left at 14:54 and the offer immediately went to $0.119. From then to the close it bottomed at $0.1151.
In my original inflection point calculations I mentioned yesterday confirmed the volatility wasn't really gone yet. Those changes over one day had all periods weakening. The aggregate change over five days had all six periods weakening and the rate of change was weaker across the board as well. Today the changes over one day are essentially flat with minor changes up and down across various periods. The changes in aggregate over five days has five periods down and one with minor improvement. However, the rate of change is weakening in all six periods.
I've mentioned the original calculations had no bullish pattern. All periods are now showing reducing readings on the charts - a bearish slant is starting to emerge again.
Of The newer version of the experimental calculations I said "If this pattern strengthens, expect lower VWAPs to appear". Again, today's short-form is "look at the charts". Yesterday's one-day change with five periods with reducing weakening has morphed into all six periods weakening again. Yesterday's aggregate change over five days was clear on the charts though - all periods with weakening and the 100 and 200-day periods notable at -5612.53% and -1169.07% respectively. Today is a repeat with all periods weakening and the three longer periods having very large negative changes. The rates of change over five days is showing some slowing of the descent though - only the two shortest periods are weakening and the other four are showing decent improvements.
Regardless, with the volatility apparently still here, I wouldn't place wagers on any of this.
Here's a trading breakdown by arbitrary time-frames.
09:30-09:31: 050000 shrs, 06.26% of vol, VWAP $0.1130, 000.0% buys
09:37-09:38: 031250 shrs, 03.91% of vol, VWAP $0.1121, 000.0% buys
09:41-09:59: 108500 shrs, 13.59% of vol, VWAP $0.1145, 013.8% buys
10:19-10:29: 234000 shrs, 29.31% of vol, VWAP $0.1109, 015.8% buys
10:34-11:59: 064600 shrs, 08.09% of vol, VWAP $0.1117, 050.5% buys
12:15-12:34: 015500 shrs, 01.94% of vol, VWAP $0.1130, 100.0% buys
12:35-12:35: 010000 shrs, 01.25% of vol, VWAP $0.1194, 100.0% buys
12:48-13:16: 087450 shrs, 10.95% of vol, VWAP $0.1128, 001.7% buys
13:17-13:49: 107500 shrs, 13.47% of vol, VWAP $0.1135, 060.5% buys
14:41-14:56: 037000 shrs, 04.63% of vol, VWAP $0.1146, 035.1% buys
15:29-15:59: 052499 shrs, 06.58% of vol, VWAP $0.1150, 043.8% buys
Here's a breakdown by arbitrary price range.
$0.1025-$0.1025: 020000 shrs, 02.51% of vol, VWAP $0.1025, 000.0% buys
$0.1100-$0.1102: 136005 shrs, 17.04% of vol, VWAP $0.1100, 019.1% buys
$0.1110-$0.1112: 056100 shrs, 07.03% of vol, VWAP $0.1112, 019.6% buys
$0.1120-$0.1127: 192245 shrs, 24.08% of vol, VWAP $0.1121, 017.0% buys
$0.1130-$0.1132: 145500 shrs, 18.23% of vol, VWAP $0.1130, 040.9% buys
$0.1140-$0.1140: 069450 shrs, 08.70% of vol, VWAP $0.1140, 061.1% buys
$0.1150-$0.1160: 122999 shrs, 15.41% of vol, VWAP $0.1151, 012.2% buys
$0.1189-$0.1200: 056000 shrs, 07.01% of vol, VWAP $0.1197, 046.4% buys
Some day-to-day VWAP changes, with the end date shown and the percentage change from the prior day. Buy percentage is the last value on each line.
01/17 $0.1004 +04.15% 62.5%
01/21 $0.0997 -00.75% 51.7%
01/22 $0.0998 +00.10% 30.0%
01/23 $0.0937 -06.05% 27.6%
01/24 $0.0947 +01.08% 24.0%
01/27 $0.0925 -02.34% 35.6%
01/28 $0.0908 -01.82% 17.5%
01/29 $0.0914 +00.60% 30.2%
01/30 $0.0946 +03.55% 09.6%
01/31 $0.0997 +05.33% 53.9%
02/03 $0.1038 +04.14% 55.6%
02/04 $0.1092 +05.16% 40.5%
02/05 $0.1163 +06.52% 39.6%
02/06 $0.1124 -03.33% 41.7%
02/07 $0.1153 +02.56% 36.8%
02/10 $0.1128 -02.17% 26.6%
Using the new 80% calculation 1/3 onward. This week's daily estimated values (older dailys in prior EOD posts in prior blog) for next share issue:
02/10: 20 lowest intra-day VWAPs in 40 days avg, $0.0973, x 80%: $0.0779
Vol in K, for above days: 798.30.
Week ending summaries of PIPE financing estimated 85% share pricing, "Dly Sht % of 'sells'", and inflection points here are in the latest daily post above.
02/07/2014: EOD stuff partially copied to the concentrator.
# Trds: 173, MinTrSz: 23, MaxTrSz: 78000, Vol: 1974244, AvTrSz: 11412
Min. Pr: 0.1101, Max Pr: 0.1210, VW Avg. Tr. Pr: 0.1153
# Buys, Shares: 68 727067, VW Avg Buy Pr: 0.1164
# Sells, Shares: 104 1241177, VW Avg Sell Pr: 0.1146
# Unkn, Shares: 1 6000, VW Avg Unk. Pr: 0.1160
Buy:Sell 1:1.71 (36.83% "buys"), DlyShts 570127 (28.88%), Dly Sht % of 'sells' 45.93%
The average of the lowest 20 VWAPs times 80% today is $0.0779 vs. $0.0779, $0.0779, $0.0779, $0.0779, $0.0779, $0.0780, $0.0783, $0.0787 and $0.0792 $0.0797 on prior days. 80% of today's VWAP is $0.0922 vs. $0.0899, $0.0930, $0.0873, $0.0830, $0.0797, $0.0757, $0.0731, $0.0727 and $0.0740 on prior days. These are potential prices for the next tranche of shares to the PIPErs.
Today's low, high, VWAP, trade volume, and daily short sales moved 1.47%, 0.83%, 2.56%, 154.77% and 331.59% respectively. Price spread today was 9.90% vs. 10.60%, 10.71%, 16.86%, 18.88%, 22.83%, 8.69%, 10.25%, 1.43% and 13.00% on prior days.
31 of 173 trades, 17.92%, were of size 15K or greater, constituting 51.09% of day's volume, or 1,008,700 shares. 20 were sells totaling 645,000 shares, 63.94% of these larger trades, at a VWAP of $0.1154. The 11 buys totaled 363,700 shares, 36.06% of the large trades, at a VWAP of $0.1183.
A few of these were notable for being near the day's $0.121 high: $0.1200 x 65K, $0.1195 x 68K, $0.1195 x 73K and $0.1200 x 76.7K. There were also two at $0.1121 for 68K and 78K.
The trades smaller than 15K, comprising 965,544 shares, had a VWAP of $0.1141, with 37.63%, 363,367, buys at a VWAP of $0.1146 and 61.75%, 596,177, were sells at a VWAP of $0.1137. 6,000 shares were unknown at a VWAP of $0.1160.
So the sentiment of the larger and smaller trades were in agreement.
Yesterday I noted what I thought was a change after four consecutive day of selling into strength. One factor was the change in VWAPs over this period of $0.0997, $0.1038, $0.1092, $0.1163 and yesterday's lower $0.1124. The change in view was supported by the sell percentages during this period, which were 43.21%, 42.28%, 59.26%, 60.38% and 43.2%, along with reducing volume, in thousands, of 1,141.11, 1,411.57, 848.20, 301.06 and 774.9. Throw in falling buy percentages of 53.89%, 55.61%, 40.46%, 39.6% and yesterdays' 21.14%. All this with VWAP rising until yesterday.
Today's higher VWAP of $0.1153 fell between yesterdays $0.1124 and Wednesday's $0.1163 with volume up 154.77% to 1.974 million shares traded. Buy and sell percentages were 36.83% and 62.87% respectively. So we again see selling into any strength. I expect continued selling into any strength and a weakening VWAP to be the near-term trend.
Today's buy percentage of 36.8% is at the high side of the 10, 25, 50 and 100-day averages of 35.90%, 36.71%, 33.13% and 32.25% respectively. As discussed in the past, this should produce a higher short sales percentage. Today moved up from yesterday's 17.05% to 28.88%, pretty much in line with the averages of 31.62%, 31.44%, 24.78% and 21.56% for periods of 10, 25, 50 and 100-days respectively.
As discussed before, this daily short percentage seems to be following the normal pattern of vacillation in a down leg. However, there seems to be a change going on and I'm not sure if it's a temporary or more long-lived one. Both the averages and the visual assessment of the chart suggest that we may be returning to a more normal daily short sales profile with fewer and less-radical swings. But that may be an effect of this recent selling into strength, so I'll wait before deciding what I think. Right now I'm guessing that a likely weakening of price and buy percentage will appear shortly (pun intended) and the volatile behavior will surface once again.
On the traditional TA front, recalling my mention of a topping pattern and a "hanging man" candlestick, I thought we had a high probability of a reversal. It may be starting already in spite of a higher open, low and high as we closed at $0.1131, much nearer the low of $0.1101 than the high of $0.1210.
Yesterday I said I expect a little volatility over the next few days with generally increasing spreads and the development of a downward bias in price. Today's action looks like the start of that.
Full stochastic exited overbought today, which was entered just yesterday. When strength is really present it's common for this to stay in overbought for an extended period. This quick exit does not bode well. RSI, momentum and ADX and related continued to weaken. The other oscillators still haven't responded to what I see yet - MFI and Williams %R are still rising and MFI still has a reducing slope developing.
The MACD continues the bullish move but it's histogram has weakened now.
ARCA entered the sell side at 11:16 offering at $0.118, barely below the best offer of $0.12 at the time. In the usual fashion, they were down to $0.1151 by 11:42 and exited at 11:44, whereupon the offer immediately moved to $0.117 (hm, same as yesterday's recovery). Before ARCA's return at 12:29, offers got as high as $0.119 at 12:20, but weakened from there to $0.1165 when NITE, who has been much more aggressive recently, popped that offer in when $0.118 was best at the time. ARCA reentered with an $0.1174 offer and the usual deterioration began immediately, hitting a low of $0.111 (by ARCA) at 13:45, just an hour and a quarter later. They stayed in until 14:57, but were less aggressive and NITE, BTIG and CSTI were often atop "The Leader Board" as price offers got as high as $0.122 just before 15:00. Just before ARCA's exit, they did fire a parting shot (or so I thought) of $0.115 that was bought and they exited two minutes later.
But ARCA came back at 15:43 with the lowest offer of the day, $0.1113, which is where we closed.
ARCA again did not appear on the bid today.
Yesterday I guessed the volatility in my original inflection point calculations, which I had thought might be abating, was not really gone yet. Might have been a head fake and stay with us. Well, that was prescient. Today the changes over one day has all periods weakening and the 5-day by a very large number, down 1.501.1%. The aggregate change over five days has all six periods weakening and the rate of change is weaker across the board as well.
I mentioned yesterday the original calculations had no bullish pattern. Yesterday's and today's stuff confirms that. The flattening which had appeared, and could have been viewed as a refreshing change of trend if it holds, is kaput. I had said with our lack of stability I was wondering if it can hold. Now we know.
Regarding the newer version of the experimental calculations I said "The rooster has come home to roost, apparently ... All periods for the one-day, five-day aggregate change and their rates of change are losing strength. If this pattern strengthens, expect lower VWAPs to appear". Again, today's short-form is "look at the charts". What's not shown there is that the one-day change has five periods with reducing weakening. The aggregate change over five days is clear on the charts though - all periods with weakening and the 100 and 200-day periods notable at -5612.53% and -1169.07% respectively. Values of this magnitude are not often seen. However, with them being affected by what falls out of the calculation periods, we shouldn't go into panic mode. Over a couple days they will likely come back to more normal magnitudes.
As I've mentioned, with our current environment I don't know how useful these are.
Here's a trading breakdown by arbitrary time-frames.
09:54-10:18: 006000 shrs, 00.30% of vol, VWAP $0.1172, 100.0% buys
10:59-11:05: 012500 shrs, 00.63% of vol, VWAP $0.1155, 000.0% buys
11:09-11:15: 083000 shrs, 04.20% of vol, VWAP $0.1175, 075.9% buys
11:17-12:08: 069200 shrs, 03.51% of vol, VWAP $0.1155, 033.2% buys
12:10-12:22: 071100 shrs, 03.60% of vol, VWAP $0.1177, 016.3% buys
12:24-12:34: 271300 shrs, 13.74% of vol, VWAP $0.1150, 000.0% buys
12:35-12:53: 087984 shrs, 04.46% of vol, VWAP $0.1119, 025.6% buys
12:54-13:34: 074250 shrs, 03.76% of vol, VWAP $0.1118, 073.1% buys
13:36-14:53: 109610 shrs, 05.55% of vol, VWAP $0.1113, 042.2% buys
14:54-14:54: 089777 shrs, 04.55% of vol, VWAP $0.1178, 100.0% buys
14:55-15:04: 312600 shrs, 15.83% of vol, VWAP $0.1190, 024.5% buys
15:05-15:10: 131123 shrs, 06.64% of vol, VWAP $0.1176, 043.6% buys
15:16-15:17: 302000 shrs, 15.30% of vol, VWAP $0.1159, 051.7% buys
15:19-15:31: 181000 shrs, 09.17% of vol, VWAP $0.1121, 024.3% buys
15:32-15:53: 127800 shrs, 06.47% of vol, VWAP $0.1112, 040.5% buys
15:54-15:57: 045000 shrs, 02.28% of vol, VWAP $0.1127, 055.6% buys
Here's a breakdown by arbitrary price range.
$0.1101-$0.1107: 047000 shrs, 02.38% of vol, VWAP $0.1103, 000.0% buys
$0.1110-$0.1115: 272100 shrs, 13.78% of vol, VWAP $0.1112, 031.9% buys
$0.1120-$0.1123: 415060 shrs, 21.02% of vol, VWAP $0.1121, 032.4% buys
$0.1130-$0.1139: 020884 shrs, 01.06% of vol, VWAP $0.1135, 100.0% buys
$0.1142-$0.1142: 015000 shrs, 00.76% of vol, VWAP $0.1142, 000.0% buys
$0.1150-$0.1152: 449100 shrs, 22.75% of vol, VWAP $0.1150, 007.0% buys
$0.1160-$0.1160: 023123 shrs, 01.17% of vol, VWAP $0.1160, 074.1% buys
$0.1170-$0.1175: 102588 shrs, 05.20% of vol, VWAP $0.1172, 100.0% buys
$0.1180-$0.1180: 140000 shrs, 07.09% of vol, VWAP $0.1180, 010.7% buys
$0.1190-$0.1199: 196000 shrs, 09.93% of vol, VWAP $0.1195, 100.0% buys
$0.1200-$0.1200: 273389 shrs, 13.85% of vol, VWAP $0.1200, 037.5% buys
$0.1210-$0.1210: 020000 shrs, 01.01% of vol, VWAP $0.1210, 100.0% buys
Some day-to-day VWAP changes, with the end date shown and the percentage change from the prior day. Buy percentage is the last value on each line.
01/16 $0.0964 -00.89% 34.8%
01/17 $0.1004 +04.15% 62.5%
01/21 $0.0997 -00.75% 51.7%
01/22 $0.0998 +00.10% 30.0%
01/23 $0.0937 -06.05% 27.6%
01/24 $0.0947 +01.08% 24.0%
01/27 $0.0925 -02.34% 35.6%
01/28 $0.0908 -01.82% 17.5%
01/29 $0.0914 +00.60% 30.2%
01/30 $0.0946 +03.55% 09.6%
01/31 $0.0997 +05.33% 53.9%
02/03 $0.1038 +04.14% 55.6%
02/04 $0.1092 +05.16% 40.5%
02/05 $0.1163 +06.52% 39.6%
02/06 $0.1124 -03.33% 41.7%
02/07 $0.1153 +02.56% 36.8%
Using the new 80% calculation 1/3 onward. This week's daily estimated values (older dailys in prior EOD posts in prior blog) for next share issue:
02/03: 20 lowest intra-day VWAPs in 40 days avg, $0.0973, x 80%: $0.0779
02/04: 20 lowest intra-day VWAPs in 40 days avg, $0.0973, x 80%: $0.0779
02/05: 20 lowest intra-day VWAPs in 40 days avg, $0.0973, x 80%: $0.0779
02/06: 20 lowest intra-day VWAPs in 40 days avg, $0.0973, x 80%: $0.0779
02/07: 20 lowest intra-day VWAPs in 40 days avg, $0.0973, x 80%: $0.0779
Vol in K, for above days: 2,994.36 2,174.20 982.66 774.90, 1,974.24.
Week ending summaries of PIPE financing estimated 85% share pricing, "Dly Sht % of 'sells'", and inflection points here are ae in the latest daily post above.
02/06/2014: EOD stuff partially copied to the concentrator.
# Trds: 87, MinTrSz: 200, MaxTrSz: 95200, Vol: 774900, AvTrSz: 8907
Min. Pr: 0.1085, Max Pr: 0.1200, VW Avg. Tr. Pr: 0.1124
# Buys, Shares: 40 323500, VW Avg Buy Pr: 0.1125
# Sells, Shares: 40 334900, VW Avg Sell Pr: 0.1122
# Unkn, Shares: 7 116500, VW Avg Unk. Pr: 0.1126
Buy:Sell 1:1.04 (41.75% "buys"), DlyShts 132100 (17.05%), Dly Sht % of 'sells' 38.19%
There were 5 AH trades of totaling 109K that FINRA-reported daily short sales don't include. Adding that to the FINRA trade volume raises it from 665,900 to 774,900 and would lower the [FINRA-based] short percentage from 19.84% to 17.05%. If the shares are also added to the short sales, the short volume moves from 132,100 to 241,100 and the short percentage would be 32.59%. These were marked "seq", meaning they were traded during normal market hours but were not reported in a timely manner.
With our buy percentage above 40% today I suspect a goodly portion of this 109K were short sales.
The average of the lowest 20 VWAPs times 80% today is $0.0779 vs. $0.0779, $0.0779, $0.0779, $0.0779, $0.0780, $0.0783, $0.0787, $0.0792 and $0.0797 on prior days. 80% of today's VWAP is $0.0899 vs. $0.0930, $0.0873, $0.0830, $0.0797, $0.0757, $0.0731, $0.0727, $0.0740 and $0.0758 on prior days. These are potential prices for the next tranche of shares to the PIPErs.
Today's low, high, VWAP, trade volume, and daily short sales moved -1.54%, -1.64%, -3.33%, -21.14% and -56.12% respectively. Price spread today was 10.60% vs. 10.71%, 16.86%, 18.88%, 22.83%, 8.69%, 10.25%, 1.43%, 13.00% and 4.73% on prior days.
Of 87 trades, 10 larger trades (>=14,999 size today), 11.49% of the day's trades, constituted 45.97% of day's volume, or 356,199 shares. Seven were sells totaling 151,999 shares at a VWAP of $0.1121. The two buys totaled 109,000 shares at a VWAP of $0.1128. 42.67% of shares in larger block trades were sells, 30.60% were buys and one trade for 95.2K at $0.1121 was 26.73%.
Whereas we had four consecutive day of what I think was selling into strength, that changed today. The VWAPS over this period were $0.0997, $0.1038, $0.1092 and $0.1163. Today our VWAP was down, $0.1124. The sell percentages while selling into strength were 43.21%, 42.28%, 59.26% and 60.38%. Today it was 43.2%. I had mentioned less strengthening over the last couple days, as suggested by reduced volume (in thousands: 1,141.11, 1,411.57, 848.20 and 301.06) as buy percentages fell (53.89%, 55.61%, 40.46% and 39.6%) as VWAP continued higher.
Today had lower VWAP, essentially flat buy percentage and volume down 21.14% to 774.9K. Strength is waning.
I had mentioned the falling buy percentages were in conjunction with daily short sales percentages also falling: 43.88%, 47.14%, 39.01% and 30.64%. Today continued the trend with a 17.05% short percentage, but do keep in mind the note above about the "seq" trades. Regardless, the maximum short percentage if all the 109K were shorts would be 32.59% - only a couple points above yesterday's. So the general trend would still be with the script. If the 109K had a short percentage somewhere around the percentage associated with the reported trades, we'd still be around 17%, which seems more likely than the extreme case.
The point of discussing this is that reducing short percentage is generally associated with reducing price. If this daily short percentage follows the normal pattern, it's got a ways to drop before it start another yo-yo up move. And that will be noting more than normal vacillation in down leg.
On the traditional TA front recall I had mentioned a topping pattern and a "hanging man" candlestick suggesting indecision and a coming reversal and regardless of Bulkowski's "59% of the time, near random, it's a bullish continuation pattern" I thought with the other factors we see, we can give a high probability to a reversal in this case.
Today was the first break in what I think will develop over the next few days. We had a lower high and low, which looks like it was right on my longer-term descending support (formerly resistance) at ~$0.1085 AFAICT. I expect a little volatility over the next few days with generally increasing spreads and the development of a downward bias in price.
Full stochastic entered overbought today as RSI, momentum and ADX and related continued to weaken. I think this combination is strongly suggestive of coming price action. The other oscillators haven't respond to what I see yet - MFI and Williams %R are still rising but MFI has a reducing slope developing.
The MACD, and it's histogram, continue the bullish move.
ARCA entered the sell side at 10:25 with a offer of $0.114, undercutting the $0.1151 at the time. In the usual fashion, they were down to $0.11 by 11:07 and exited at 11:15, whereupon the offer immediately moved to $0.117.
So what did they do? Well, three minutes later they returned with a $0.111 offer! I guess they didn't want to lose the downward momentum. In four minutes the offer was down to $0.11 and it hovered around there until hitting $0.113 at 13:00 and starting a climb back up from there, getting as high as $0.1159 at 14:45 and $0.1169 at 15:45 when ARCA exited again.
ARCA did not appear on the bid today.
I mentioned the volatility in my original inflection point calculations might be abating with yesterday's one-day readings having everything essentially flat. Today the one-day change has the one-hundred day period flat and all others again showing minor improvement. The aggregates over five days, which was negative yesterday with five of the periods weaker, has all periods improving. The rates of change over those days also have all six periods improving.
So, in net, I guess it's not really gone yet. Might have been a head fake and stay with us.
I mentioned yesterday the original calculations had no bullish pattern. Today's stuff confirms that none was beginning. However, a flattening has appeared which can be viewed as a refreshing change of trend if it holds. With our lack of stability though, I'm wondering if it can hold.
Recall that the newer version of the calculations had begun forming a pattern that could lead to a bullish call, was still developing, the 5-day period had gone positive, and the last time we saw a positive reading it was descending from highs seen of ~80 on the 5-day period on 7/29 and our VWAP had peaked at $0.1808 on 7/24.
Yesterday's one-day moves had five periods with minuscule improvements and the five-day period showing substantial weakening. The aggregate change over five days, had all periods weakening, with the five-day period being notable. The rates of change for these days were also all weaker.
The rooster has come home to roost, apparently. The short form is "look at the charts". All periods for the one-day, five-day aggregate change and their rates of change are losing strength. If this pattern strengthens, expect lower VWAPs to appear.
As I've mentioned, with our current environment I don't know how useful these are.
Here's a trading breakdown by arbitrary time-frames.
09:30-09:30: 000200 shrs, 00.03% of vol, VWAP $0.1132, 000.0% buys
09:30-09:38: 012900 shrs, 01.66% of vol, VWAP $0.1200, 024.8% buys
09:47-10:07: 049000 shrs, 06.32% of vol, VWAP $0.1179, 051.0% buys
10:16-10:25: 133000 shrs, 17.16% of vol, VWAP $0.1151, 057.1% buys
10:32-11:04: 084000 shrs, 10.84% of vol, VWAP $0.1126, 020.8% buys
11:05-11:29: 135800 shrs, 17.52% of vol, VWAP $0.1101, 070.5% buys
11:30-11:59: 090000 shrs, 11.61% of vol, VWAP $0.1091, 044.4% buys
12:02-12:46: 075000 shrs, 09.68% of vol, VWAP $0.1101, 040.0% buys
13:01-13:43: 020000 shrs, 02.58% of vol, VWAP $0.1102, 000.0% buys
14:21-15:46: 027000 shrs, 03.48% of vol, VWAP $0.1130, 007.4% buys
15:47-15:59: 039000 shrs, 05.03% of vol, VWAP $0.1150, 059.0% buys
17:35-18:33: 109000 shrs, 14.07% of vol, VWAP $0.1121, 000.0% buys
Here's a breakdown by arbitrary price range.
$0.1085-$0.1088: 045000 shrs, 05.81% of vol, VWAP $0.1087, 044.4% buys
$0.1090-$0.1092: 036000 shrs, 04.65% of vol, VWAP $0.1090, 000.0% buys
$0.1100-$0.1102: 230800 shrs, 29.78% of vol, VWAP $0.1101, 058.8% buys
$0.1110-$0.1110: 010000 shrs, 01.29% of vol, VWAP $0.1110, 100.0% buys
$0.1120-$0.1122: 156500 shrs, 20.20% of vol, VWAP $0.1121, 000.0% buys
$0.1130-$0.1132: 058700 shrs, 07.58% of vol, VWAP $0.1130, 016.2% buys
$0.1140-$0.1149: 044000 shrs, 05.68% of vol, VWAP $0.1144, 052.3% buys
$0.1151-$0.1159: 118000 shrs, 15.23% of vol, VWAP $0.1152, 061.0% buys
$0.1160-$0.1168: 014000 shrs, 01.81% of vol, VWAP $0.1166, 100.0% buys
$0.1170-$0.1170: 012000 shrs, 01.55% of vol, VWAP $0.1170, 100.0% buys
$0.1180-$0.1188: 037000 shrs, 04.77% of vol, VWAP $0.1182, 035.1% buys
$0.1200-$0.1200: 012900 shrs, 01.66% of vol, VWAP $0.1200, 024.8% buys
Some day-to-day VWAP changes, with the end date shown and the percentage change from the prior day. Buy percentage is the last value on each line.
01/15 $0.0973 -02.02% 14.6%
01/16 $0.0964 -00.89% 34.8%
01/17 $0.1004 +04.15% 62.5%
01/21 $0.0997 -00.75% 51.7%
01/22 $0.0998 +00.10% 30.0%
01/23 $0.0937 -06.05% 27.6%
01/24 $0.0947 +01.08% 24.0%
01/27 $0.0925 -02.34% 35.6%
01/28 $0.0908 -01.82% 17.5%
01/29 $0.0914 +00.60% 30.2%
01/30 $0.0946 +03.55% 09.6%
01/31 $0.0997 +05.33% 53.9%
02/03 $0.1038 +04.14% 55.6%
02/04 $0.1092 +05.16% 40.5%
02/05 $0.1163 +06.52% 39.6%
02/06 $0.1124 -03.33% 41.7%
Using the new 80% calculation 1/3 onward. This week's daily estimated values (older dailys in prior EOD posts in prior blog) for next share issue:
02/03: 20 lowest intra-day VWAPs in 40 days avg, $0.0973, x 80%: $0.0779
02/04: 20 lowest intra-day VWAPs in 40 days avg, $0.0973, x 80%: $0.0779
02/05: 20 lowest intra-day VWAPs in 40 days avg, $0.0973, x 80%: $0.0779
02/06: 20 lowest intra-day VWAPs in 40 days avg, $0.0973, x 80%: $0.0779
Vol in K, for above days: 2994.36 2174.20 982.66 774.90.
Week ending summaries of PIPE financing estimated 85% share pricing, "Dly Sht % of 'sells'", and inflection points here are are in the latest daily post above.
02/05/2014: EOD stuff partially copied to the concentrator.
# Trds: 118, MinTrSz: 100, MaxTrSz: 60000, Vol: 982658, AvTrSz: 8328
Min. Pr: 0.1102, Max Pr: 0.1220, VW Avg. Tr. Pr: 0.1163
# Buys, Shares: 58 389314, VW Avg Buy Pr: 0.1171
# Sells, Shares: 60 593344, VW Avg Sell Pr: 0.1157
# Unkn, Shares: 0 0, VW Avg Unk. Pr: 0.0000
Buy:Sell 1:1.52 (39.62% "buys"), DlyShts 301064 (30.64%), Dly Sht % of 'sells' 50.74%
The average of the lowest 20 VWAPs times 80% today is $0.0779 vs. $0.0779, $0.0779, $0.0779, $0.0780, $0.0783, $0.0787, $0.0792, $0.0797 and $0.0801 on prior days. 80% of today's VWAP is $0.0930 vs. $0.0873, $0.0830, $0.0797, $0.0757, $0.0731, $0.0727, $0.0740, $0.0758 and $0.0750 on prior days. These are potential prices for the next tranche of shares to the PIPErs.
There's some notable trades. $0.1220, a single pre-market trade of 15K. There were two more trades at this price, 9K and 5k at the open, mixed in with eleven trades in the first minute. This first minute also included some $0.1219 trades. These $0.1220 and $0.1219 trades totaled 73K and those prices weren't seen for the rest of the day. The next highest price seen was $0.12.
Today's low, high, VWAP, trade volume, and daily short sales moved 7.41%, 1.75%, 6.52%, -54.80% and -64.51% respectively. Price spread today was 10.71% vs. 16.86%, 18.88%, 22.83%, 8.69%, 10.25%, 1.43%, 13.00%, 4.73% and 44.79% on prior days.
Of 118 trades, 15 larger trades (>=15K size), 12.71% of the day's trades, constituted 40.98% of day's volume, or 402,700 shares. Nine were sells totaling 280,100 shares at a VWAP of $0.1162. The six buys totaled 122,600 shares at a VWAP of $0.1187. 69.56% of shares in larger block trades were sells and 30.44% were buys.
This is the fourth consecutive day of what I think is selling into strength. The VWAPS over this period were $0.0997, $0.1038, $0.1092 and $0.1163 today, while the sell percentages were 43.21%, 42.28%, 59.26% and 60.38% today. As with yesterday, the change today is less strengthening, as suggested by again-reduced volume (in thousands: 1,141.11, 1,411.57, 848.20 and 301.06 today) as buy percentages fall (53.89%, 55.61%, 40.46% and 39.6% today) as VWAP continues higher.
As expected, with lower buy percentages daily short sales percentages are also falling: 43.88%, 47.14%, 39.01% and 30.64% today.
On the traditional TA front, recall that I was leaning bearish, but without conviction because it was just my feeling based on past action of the MMs. Well ...
Although for the third consecutive day we traded completely above my intermediate-term descending resistance, we had a stronger negative indication today. Recall I had mentioned a topping pattern. Today adds to that with an open above the close at the high yesterday, achievement of an intra-day high that was the apex of this run up so far, and finally a close today lower than the open and lower than yesterday's close, all accompanied by reducing volume two consecutive days now.
Evidence is a whole lot better than gut hunches.
Getting all wonky, we have a "hanging man" candlestick too - suggesting indecision and a coming reversal. However, Bulkowski points out that 59% of the time, near random he says, it's a bullish continuation pattern. I think with the other factors we see, we can give a high probability to a reversal in this case.
Today the former long-term descending resistance, still looking like ~$0.1095 AFAICT, looks like support (visually, the low is sitting right on it). The accumulation/distribution today continued yesterday's minor move up, but it was a minuscule gain. The other oscillators are still mixed, but RSI went from rising to falling (didn't make it into overbought), MFI continues rising and still slightly above neutral, and the full stochastic is even nearer overbought. Momentum, which had gone bananas at 1.26, has retreated to 1.20, still suggesting upward momentum. The ADX, and related, is continues to fall.
The MACD, and it's histogram, continue the bullish move with the signal line moving higher above 0. The histogram is now above levels seen in the middle of October when we had a new all-time low of $0.10 on 10/8-10 followed by a rise into the last week of October to a high of $0.1385.
ARCA entered the sell side at 09:40 with a bid of $0.12, third in line behind ATDF's $0.1198 and NITE's $0.1199. The jostling began and in three minutes ARCA took the lead with a $0.117 offer. By 09:50 they were gone and didn't return until 10:18. During their absence, best offer got as high as $0.1189 just before ARCA re-entered and they posted a $0.117 best offer. They stayed only 15 minutes and the best offer recovered to $0.1186, but the usual pattern had been established and it was down to $0.117 again at 12:00. It had climbed back up to $0.18 when ARCA returned at 12:27 with an offer of $0.1179. Offers had dropped to $0.1131 by 13:22 and when ARCA was gone at 14:33, best offer recovered to $0.118 from the $0.114 at 14:17. ARCA did not return and offers recovered to $0.1179 at 15:24.
ARCA did not appear on the bid today.
The volatility in my original inflection point calculations might be abating with today's one-day readings having everything essentially flat, although minuscule up and down variations are present in each of the periods. The aggregates over five days have are less sanguine with five of the periods weaker and the rates of change over those days have all six periods weaker.
I mentioned yesterday the original calculations had no bullish pattern. Today's stuff confirms that none was beginning.
I had mentioned the newer version had been forming the pattern that could lead to a bullish call, was still developing and the 5-day period has actually gone positive at 50.41. I said it wasn't a big positive and the last time we saw a positive reading it was descending from highs seen of ~80 on the 5-day period on 7/29 and our VWAP had peaked at $0.1808 on 7/24.
Today's one-day moves have five periods with minuscule improvements and only the five-day period showing weakening, unfortunately not minuscule. The more significant metrics are the aggregate change over five days, with all periods weakening. Not large movements though, but for the five-day period. The rates of change for these days are also all weaker.
As I've mentioned, with our current environment I don't know how useful these are.
Here's a trading breakdown by arbitrary time-frames.
09:24-09:24: 015000 shrs, 01.53% of vol, VWAP $0.1220, 100.0% buys
09:30-09:41: 217508 shrs, 22.48% of vol, VWAP $0.1189, 050.6% buys
09:44-09:54: 042040 shrs, 04.34% of vol, VWAP $0.1133, 040.4% buys
09:55-10:16: 089500 shrs, 09.25% of vol, VWAP $0.1175, 036.3% buys
10:18-10:25: 037000 shrs, 03.82% of vol, VWAP $0.1155, 059.5% buys
12:00-12:27: 146200 shrs, 15.11% of vol, VWAP $0.1167, 046.0% buys
12:33-13:06: 211190 shrs, 21.82% of vol, VWAP $0.1159, 001.5% buys
13:07-14:35: 185770 shrs, 19.20% of vol, VWAP $0.1133, 062.3% buys
14:57-15:29: 017750 shrs, 01.83% of vol, VWAP $0.1142, 005.9% buys
15:46-15:58: 020700 shrs, 02.14% of vol, VWAP $0.1157, 026.6% buys
Here's a breakdown by arbitrary price range.
$0.1102-$0.1121: 035040 shrs, 03.57% of vol, VWAP $0.1112, 000.0% buys
$0.1130-$0.1136: 209670 shrs, 21.34% of vol, VWAP $0.1132, 049.5% buys
$0.1140-$0.1149: 041400 shrs, 04.21% of vol, VWAP $0.1143, 029.0% buys
$0.1150-$0.1154: 143190 shrs, 14.57% of vol, VWAP $0.1150, 017.7% buys
$0.1160-$0.1169: 211500 shrs, 21.52% of vol, VWAP $0.1165, 004.7% buys
$0.1170-$0.1179: 096250 shrs, 09.79% of vol, VWAP $0.1171, 099.5% buys
$0.1180-$0.1189: 075600 shrs, 07.69% of vol, VWAP $0.1188, 052.2% buys
$0.1198-$0.1199: 029904 shrs, 03.04% of vol, VWAP $0.1199, 100.0% buys
$0.1200-$0.1200: 067104 shrs, 06.83% of vol, VWAP $0.1200, 000.0% buys
$0.1219-$0.1220: 073000 shrs, 07.43% of vol, VWAP $0.1219, 100.0% buys
Some day-to-day VWAP changes, with the end date shown and the percentage change from the prior day. Buy percentage is the last value on each line.
01/14 $0.0993 -03.94% 31.8%
01/15 $0.0973 -02.02% 14.6%
01/16 $0.0964 -00.89% 34.8%
01/17 $0.1004 +04.15% 62.5%
01/21 $0.0997 -00.75% 51.7%
01/22 $0.0998 +00.10% 30.0%
01/23 $0.0937 -06.05% 27.6%
01/24 $0.0947 +01.08% 24.0%
01/27 $0.0925 -02.34% 35.6%
01/28 $0.0908 -01.82% 17.5%
01/29 $0.0914 +00.60% 30.2%
01/30 $0.0946 +03.55% 09.6%
01/31 $0.0997 +05.33% 53.9%
02/03 $0.1038 +04.14% 55.6%
02/04 $0.1092 +05.16% 40.5%
02/05 $0.1163 +06.52% 39.6%
Using the new 80% calculation 1/3 onward. This week's daily estimated values (older dailys in prior EOD posts in prior blog) for next share issue:
02/03: 20 lowest intra-day VWAPs in 40 days avg, $0.0973, x 80%: $0.0779
02/04: 20 lowest intra-day VWAPs in 40 days avg, $0.0973, x 80%: $0.0779
02/05: 20 lowest intra-day VWAPs in 40 days avg, $0.0973, x 80%: $0.0779
Vol in K, for above days: 2994.36 2174.20 982.66.
Week ending summaries of PIPE financing estimated 85% share pricing, "Dly Sht % of 'sells'", and inflection points here are in the latest daily post above.
02/04/2014: EOD stuff partially copied to the concentrator.
# Trds: 290, MinTrSz: 206, MaxTrSz: 77500, Vol: 2174203, AvTrSz: 7497
Min. Pr: 0.1026, Max Pr: 0.1199, VW Avg. Tr. Pr: 0.1092
# Buys, Shares: 127 879678, VW Avg Buy Pr: 0.1095
# Sells, Shares: 161 1288525, VW Avg Sell Pr: 0.1090
# Unkn, Shares: 2 6000, VW Avg Unk. Pr: 0.1031
Buy:Sell 1:1.46 (40.46% "buys"), DlyShts 848197 (39.01%), Dly Sht % of 'sells' 65.83%
The average of the lowest 20 VWAPs times 80% today is $0.0779 vs. $0.0779, $0.0779, $0.0780, $0.0783, $0.0787, $0.0792, $0.0797, $0.0801 and $0.0805 on prior days. 80% of today's VWAP is $0.0873 vs. $0.0830, $0.0797, $0.0757, $0.0731, $0.0727, $0.0740, $0.0758, $0.0750 and $0.0798 on prior days. These are potential prices for the next tranche of shares to the PIPErs.
There were two trades that were notable: a single $0.1026 x 22.5K for the low of the day, and a single $0.1199 x 12.6K trade. NOTE! That $0.1199 trade was the last of the day, at 15:59:58, 2 seconds before the close, and is considered a candidate for TFH manipulation suspicions! With a cost of $1510.74 plus fees, it would be cheap enough for someone like ... oh, a PIPEr. Keep these two in mind as you think about the following data.
Today's low, high, VWAP, trade volume, and daily short sales moved 2.50%, 0.76%, 5.16%, -27.39% and -39.91% respectively. Price spread today was 16.86% vs. 18.88%, 22.83%, 8.69%, 10.25%, 1.43%, 13.00%, 4.73%, 44.79% and 14.26% on prior days.
If we remove those notable trades mentioned above, the low moves to $0.1030 and the high moves to $0.1150. We had multiple trades at these alternate low and high prices. Using those prices today's low, high, VWAP, trade volume, and daily short sales would've moved 2.90%, -3.36%, 5.16%, -27.39% and -39.91% respectively, and the spread would drop to 11.65%.
There were 29 larger trades (>=15K size), 10.00% of the day's 290 trades, for 766300 shares, 35.25% of day's volume of 2,174,203. Buys were 199,700 shares, 26.06% of the large block volume at a VWAP of $0.1112. Sells were 566,600 shares, 73.94% of large blocks volume at a VWAP of $0.1088. Yesterday the buy and sell VWAPs were identical to each other at $0.1041, quite odd.
This is the third consecutive day of what I think is selling into strength. The change today is less strengthening, as suggested by reducing volume and buy percentage (53.89%, 55.61% and today 40.46%) even as VWAP continues higher. This is traditional topping behavior.
Do recall that this run was started by ARCA on the bid side on 1/30 - see that day's post for some discussion of what I perceive as manipulation of the market to benefit the PIPErs. JP's comment that the fund managers traditionally get their money (by working price up?) near pipe end seems to support this. Add in that today ARCA again came strong on the bid pushing price higher (see below).
I mentioned yesterday that the daily short percentage would remain high (43.88% and 47.14% the prior two days) as long as buy percentage is high (53.9% and 55.6% the prior two days). Today the lower buy percentage, 40.5%, did produce a lower short sales percentage, 39.01%, as expected. Of course, this behavior is not in isolation and is affected by the action of the prior days - another time with lower buy percentage may still produce higher daily short sales.
On the traditional TA front I've said I'm leaning bearish, but can't have conviction because it's just my feeling based on past action of the MMs without strong indications countering that. The fact that ARCA started this on 1/30 with their behavior doesn't help - I'm ever more suspicious. Regardless ...
For the second consecutive day we traded completely above my intermediate-term descending resistance, looking like ~$0.0975 AFAICT, at a low of $0.1026 (a one-off - we could say $0.1030). We also had some trading above my long-term descending resistance of ~$0.1095 today and, unlike yesterday, closed above it at $0.1199 (a suspicious one-off - we could use $0.1150). The accumulation/distribution made a minor move up today, but is still strongly in distribution mode. The other oscillators are mixed. RSI is rising and just below overbought at 69.64, MFI is rising and just broke above neutral, barely, at 51.74, and the full stochastic is pushing near overbought and will likely hit it in a few more days. Momentum has gone bananas at 1.26 - a strong upward momentum indication.
Even the MACD, and it's histogram, have gotten all bullish with the signal line above 0 and the average close behind. The histogram is at levels not seen since the middle of October when we had a new all-time low of $0.10 on 10/8-10 followed by a rise into the last week of October to a high of $0.1385.
On the other side, we know what happened thereafter, starting 11/4 - another long down trend. Anyway, currently the ADX, and related, is falling and the volume is also falling on today's rise. This last factor makes me wonder just how much more rise can be expected (manipulated?) into this market.
Three consecutive days of higher lows and highs on two days initially with higher volume and the third day lower volume makes me think the true colors of this rally are starting to show themselves. Some of the "notable" trades (see above and prior days' notes) of the last few days add to this feeling.
I might be wrong.
ARCA entered the sell side at 10:49 and jumped ahead of the $0.109 offer with a $0.108 offer. By 10:59 ARCA and BTIG had argued the offer down to $0.105 (-3.67% from $0.109). ARCA left at 11:01, but the damage continued and offer dropped further to $0.104 at 11:07 and then $0.1031 (-5.41% from $0.109) as BTIG and NITE slugged it out.
So at 11:14 I guess ARCA stopped laughing and re-entered the fray with a higher $0.104 offer, matching NITE's at the time. TEJS decided it was their turn and began tussling with ARCA and moved the offer down to $0.103 again by 11:28.
Well, that got the buyers' appetites whetted and they started pushing bids up, taking out the offers and just generally ruining any potential plans to keep price depressed. See the trading breakdown by time for a good overview of what ensued. Specifically, note the time-frame incorporating 11:42 and later because ARCA was gone by 11:42 ... and ...
Came ON THE BID at 11:43, when best bid was $0.103, with a $0.106 bid (+2.91%)! Sometime between then and 13:20 ARCA moved to $0.107 (because NITE had come with a $0.1067) and then was bested by CDEL at $0.1081 and CSTI at $0.108. From ARCA's initial bid through 12:29, 296,700 shares traded at a VWAP of $0.106 (imagine that!) with a "sell" volume of 277,700 and a sell percentage of 93.60% (6.4% buys").
After that, we started seeing higher bids and a more (slightly higher than) normal distribution of buys and sells (through the rest of the day buy percentage was 46.17%).
And that's how we got to $0.1150 just before the close and had a $0.1199 trade two seconds before the close. Hm ...
The first time ARCA pulled this push up on the buy side was 1/30 (see my post for that day). Then, price was $0.091 when they entered and looked to drop further. ARCA entered and got us up as high as $0.988, +8.57%.
That started this "bull run".
The volatility in my original inflection point calculations also continues with today's one-day readings having the five-day period strengthening, the 200-day period "flat" and the others weakening. The aggregates over five days have all six periods weaker, as do the rates of change over those days.
On the original calculations there is still no bullish pattern. I had mentioned the newer version started forming the pattern that could lead to a bullish call, but we had been there many times before with no completion. This formation is still developing and it should be noted the 5-day period has actually gone positive at 50.41! This isn't (yet) a big positive, but the last time we saw a positive reading was on 8/2 as price, and these readings, were descending from highs seen of ~80 on the 5-day period on 7/29 and our VWAP had peaked at $0.1808 on 7/24. By way of indication, the five and ten-day periods had moved up above zero on the day before. These are not the significant items though - the chart pattern is what's significant. Take a look at the pattern that started developing ~7/15 - seven days before VWAP peaked. Compare to what' began around 1/27-1/30.
As I've mentioned, with our current environment I don't know how useful these are. Adding in my suspicion that manipulation is occurring, because of the (primarily) ARCA behavior on the bids side, where it seems they don't care what they could get the shares for, and I eye have trouble believing my own eyes and calculations. These were designed with "normal" times in mind, not a PIPE with full-ratchet provisions environment.
Here's a trading breakdown by arbitrary time-frames, more detailed(?) than usual because of the unusual ARCA behavior today.
09:42-09:59: 123000 shrs, 05.66% of vol, VWAP $0.1093, 009.3% buys
10:00-10:46: 058610 shrs, 02.70% of vol, VWAP $0.1086, 052.1% buys
10:47-11:03: 052287 shrs, 02.40% of vol, VWAP $0.1051, 061.7% buys
11:08-11:42: 217500 shrs, 10.00% of vol, VWAP $0.1032, 058.9% buys
11:44-12:29: 296700 shrs, 13.65% of vol, VWAP $0.1060, 006.4% buys
12:38-13:29: 147500 shrs, 06.78% of vol, VWAP $0.1081, 038.0% buys
13:33-13:52: 166500 shrs, 07.66% of vol, VWAP $0.1091, 100.0% buys
13:53-14:13: 241400 shrs, 11.10% of vol, VWAP $0.1107, 025.8% buys
14:23-15:12: 525306 shrs, 24.16% of vol, VWAP $0.1109, 043.4% buys
15:14-15:28: 083900 shrs, 03.86% of vol, VWAP $0.1118, 025.7% buys
15:30-15:43: 100400 shrs, 04.62% of vol, VWAP $0.1121, 046.8% buys
15:45-15:50: 073400 shrs, 03.38% of vol, VWAP $0.1129, 047.7% buys
15:51-15:55: 042700 shrs, 01.96% of vol, VWAP $0.1144, 069.1% buys
15:56-15:59: 045000 shrs, 02.07% of vol, VWAP $0.1164, 028.0% buys
Here's a breakdown by arbitrary price range, more detailed than usual because of the unusual ARCA behavior today.
$0.1026-$0.1026: 022500 shrs, 01.03% of vol, VWAP $0.1026, 000.0% buys
$0.1030-$0.1035: 173000 shrs, 07.96% of vol, VWAP $0.1032, 055.5% buys
$0.1040-$0.1040: 032000 shrs, 01.47% of vol, VWAP $0.1040, 100.0% buys
$0.1050-$0.1055: 038387 shrs, 01.77% of vol, VWAP $0.1051, 073.9% buys
$0.1060-$0.1067: 330700 shrs, 15.21% of vol, VWAP $0.1061, 005.7% buys
$0.1070-$0.1079: 015000 shrs, 00.69% of vol, VWAP $0.1078, 040.0% buys
$0.1080-$0.1089: 153000 shrs, 07.04% of vol, VWAP $0.1082, 042.4% buys
$0.1090-$0.1099: 367510 shrs, 16.90% of vol, VWAP $0.1095, 059.2% buys
$0.1100-$0.1105: 181000 shrs, 08.32% of vol, VWAP $0.1100, 010.5% buys
$0.1110-$0.1115: 444206 shrs, 20.43% of vol, VWAP $0.1110, 038.4% buys
$0.1120-$0.1123: 296100 shrs, 13.62% of vol, VWAP $0.1122, 058.8% buys
$0.1130-$0.1135: 036300 shrs, 01.67% of vol, VWAP $0.1131, 000.0% buys
$0.1148-$0.1148: 039500 shrs, 01.82% of vol, VWAP $0.1148, 100.0% buys
$0.1150-$0.1150: 032400 shrs, 01.49% of vol, VWAP $0.1150, 000.0% buys
$0.1199-$0.1199: 012600 shrs, 00.58% of vol, VWAP $0.1199, 100.0% buys
Some day-to-day VWAP changes, with the end date shown and the percentage change from the prior day. Buy percentage is the last value on each line.
01/13 $0.1034 -01.76% 19.5%
01/14 $0.0993 -03.94% 31.8%
01/15 $0.0973 -02.02% 14.6%
01/16 $0.0964 -00.89% 34.8%
01/17 $0.1004 +04.15% 62.5%
01/21 $0.0997 -00.75% 51.7%
01/22 $0.0998 +00.10% 30.0%
01/23 $0.0937 -06.05% 27.6%
01/24 $0.0947 +01.08% 24.0%
01/27 $0.0925 -02.34% 35.6%
01/28 $0.0908 -01.82% 17.5%
01/29 $0.0914 +00.60% 30.2%
01/30 $0.0946 +03.55% 09.6%
01/31 $0.0997 +05.33% 53.9%
02/03 $0.1038 +04.14% 55.6%
02/04 $0.1092 +05.16% 40.5%
Using the new 80% calculation 1/3 onward. This week's daily estimated values (older dailys in prior EOD posts in prior blog) for next share issue:
02/03: 20 lowest intra-day VWAPs in 40 days avg, $0.0973, x 80%: $0.0779
02/04: 20 lowest intra-day VWAPs in 40 days avg, $0.0973, x 80%: $0.0779
Vol in K, for above days: 2994.36 2174.20
Week ending summaries of PIPE financing estimated 85% share pricing, "Dly Sht % of 'sells'", and inflection points here are in the latest daily post above.
02/03/2014: EOD stuff partially copied to the concentrator.
# Trds: 224, MinTrSz: 100, MaxTrSz: 130000, Vol: 2994364, AvTrSz: 13368
Min. Pr: 0.1001, Max Pr: 0.1190, VW Avg. Tr. Pr: 0.1038
# Buys, Shares: 115 1665296, VW Avg Buy Pr: 0.1040
# Sells, Shares: 102 1266068, VW Avg Sell Pr: 0.1036
# Unkn, Shares: 7 63000, VW Avg Unk. Pr: 0.1034
Buy:Sell 1.32:1 (55.61% "buys"), DlyShts 1411565 (47.14%), Dly Sht % of 'sells' 111.49%
This is the second consecutive day of what I think is selling into strength with continued strengthening indicated by still-increasing volume, buy percentage and VWAP. Caution may still be warranted by the behavior of the more active market-makers on the sell side. Do recall that this was started by ARCA on the bid side on 1/30 - see that day's post for some discussion of what I perceive as manipulation of the market to benefit the PIPErs. JP's comment that the fund managers traditionally get their money by working price up near pipe end seems to support this.
Today's low, high, VWAP, trade volume, and daily short sales moved 8.80%, 5.31%, 4.14%, 15.15% and 23.70% respectively. Price spread today was 18.88% vs. 22.83%, 8.69%, 10.25%, 1.43%, 13.00%, 4.73%, 44.79%, 14.26% and 31.25% on prior days.
There were three trades that were notable: $0.1001 x 10K (the only one near there - next lowest was $0.1010) and $0.1190 for 750 and 3K shares. The next highest was $0.11 and had quite a few trades and some volume. Removing these three trades moves the low and high changes to 9.78% and -2.65% and the spread narrows to 8.91%.
There were 47 larger trades, 20.98% of 224, for 1,762,492 shares, 58.86% of day's volume of 2,994,364. Buys were 1,095,051, 62.13%, of the large block volume at a VWAP of $0.1041. Sells were 650,441, 36.90%, of that volume at a VWAP of $0.1041 also. Quite odd. Unknowns were only 17K at a VWAP of $0.1030.
We had an odd trade at 14:20:16 when 20K went at $0.1040 when there was no bid or ask at that price.
46 of 224 trades, 20.54%, were >= 15K today and one was 130K. They represented 58.43% (vs. yesterday's also large 50.17%) of the day's volume and had a VWAP of $0.1041, above the $0.1034 VWAP of the ~1.245MM shares traded in smaller blocks. They had buys of 1,082,051 (including that 130K trade at $0.1099), 61.85%, at a VWAP of $0.1041 and sells of 650,441, 37.18% at a VWAP also of $0.1041.
On the traditional TA front I said I'm leaning bearish, but can't have conviction because it's just my feeling based on past action of the MMs without strong indications countering that. The fact that ARCA started this on 1/31 with their behavior doesn't help - I'm ever more suspicious. Regardless ...
We traded completely above my descending resistance, still ~$0.098 AFAICT, at a low of $0.1001 (and that was just one trade). We also had some trading above my long-term descending resistance of ~$0.1097 today, but closed below it at $0.1002. Other than the accumulation/distribution continuing to show strong and increasing distribution, all oscillators are showing improvement with two in overbought: full stochastic and Williams %R. Momentum will be there in the next day or two if this continues - it's reading 1.0681, the highest since 10/24's 1.1956. Bollinger bands are now diverging and price action is pushing hard on the upper limit of $0.1066.
Still not getting all giddy here. I'm just too TFHish regarding the PIPErs and ARCA on the bid behavior.
The average of the lowest 20 VWAPs times 80% today is $0.0779 vs. $0.0779, $0.0780, $0.0783, $0.0787, $0.0792, $0.0797, $0.0801, $0.0805 and $0.0806 on prior days. 80% of today's VWAP is $0.0830 vs. $0.0797, $0.0757, $0.0731, $0.0727, $0.0740, $0.0758, $0.0750, $0.0798 and $0.0797 on prior days. These are potential prices for the next tranche of shares to the PIPErs. N.B. I'll have to keep an eye out for JP's calculations to see when the issues and true-ups end.
There was a pre-market trade of 5K that FINRA-reported daily short sales don't include. Adding that to the FINRA trade volume raises it from 2,989,364 to 2,994,364 and would lower the short percentage from 47.22% to 47.14%. If the shares are also added to the short sales, the short volume moves from 1,411,565 to 1,415,565 and the short percentage would be 47.31%. The daily short percentage will remain high as long as buy percentage is high. But it's still lower than the 50.56% seen when the buy percentage was lower, at 51.7% on good volume, 1.16MM shares, on 1/21. So the lower short percentage highs are still in place even though buy percentages suggest that daily short percentage ought to be as high as, or higher, that what was seen 1/21.
ARCA entered the sell side by 09:32 and stayed in all day. They did not appear on the buy side. Behavior was pretty normal and by 9:58 offer had been pushed down to $0.104 from the $0.11 that ARCA, ATDF and NITE had at the top of the offers at 9:32. As usual, a little bounce up and down and by 12:08 $0.103 was best with ARCA at the front. Again at 12:58 with a $0.1101 offer. Offers managed to move back up a bit to $0.103 by stayed near that, with 5/100ths penny drops off and on, through the close.
Until just before noon bids were generally flattish, hanging mostly around $0.106/$0.107. At 11:58 best bid moved to $0.1031 and dropped as low as $0.101 at 12:13 before stabilizing in the $0.102 to $0.103 area through the rest of the day.
My original experimental calculations had started a return to volatility after a two-day respite. It continues with today's one-day readings improving in four periods after yesterday's improvement in all six periods. The same is true for the change over five days while the rate of change over those days has five periods looking better.
Yesterday the newer version had all periods showing one-day improvement just as it did the prior day. Today there are three weaker and three improved. The changes over a five-day period had only the two shortest periods improving yesterday and has five better today, as does the rate of change over those five days. The five-day period had a big surge. So volatility is back here too.
I had mentioned we'd started forming the pattern that could lead to a bullish call, but we had been there many times before with no completion. On the original, still no such pattern. On the newer version, it's looking stronger.
The five-day period is only 17 points shy of going positive, but there's a way to go for the rest of the periods to join up and make the pattern.
As I've mentioned, with our current environment I don't know how useful these are.
Here's a trading breakdown by arbitrary time-frames, more detailed(?) than usual because of the unusual ARCA behavior today. Note a pre-market trade was "Form T" which supposedly could be settling up to three days in the future or from the past. I don't know how to assign any meaning to it though.
09:21-09:21: 005000 shrs, 00.17% of vol, VWAP $0.1099, 100.0% buys
09:30-09:42: 131650 shrs, 04.40% of vol, VWAP $0.1082, 037.7% buys
09:45-09:54: 425799 shrs, 14.22% of vol, VWAP $0.1053, 011.0% buys
09:55-10:05: 174820 shrs, 05.84% of vol, VWAP $0.1038, 050.9% buys
10:06-10:28: 628000 shrs, 20.97% of vol, VWAP $0.1027, 074.7% buys
10:29-11:42: 569381 shrs, 19.02% of vol, VWAP $0.1029, 087.0% buys
11:43-11:52: 295000 shrs, 09.85% of vol, VWAP $0.1076, 061.0% buys
12:06-12:11: 102000 shrs, 03.41% of vol, VWAP $0.1028, 000.0% buys
12:12-12:21: 192500 shrs, 06.43% of vol, VWAP $0.1013, 021.0% buys
12:29-13:30: 172514 shrs, 05.76% of vol, VWAP $0.1029, 074.8% buys
13:32-14:36: 077700 shrs, 02.59% of vol, VWAP $0.1027, 051.7% buys
14:44-15:36: 116500 shrs, 03.89% of vol, VWAP $0.1023, 069.1% buys
15:37-15:58: 103500 shrs, 03.46% of vol, VWAP $0.1024, 038.6% buys
Here's a breakdown by arbitrary price range, more detailed than usual because of the unusual ARCA behavior today. Note the $0.1001 occurred only once for 10K and only two for $0.1190 for 750 and 3K shares.
$0.1001-$0.1019: 327359 shrs, 10.93% of vol, VWAP $0.1012, 010.7% buys
$0.1020-$0.1029: 638750 shrs, 21.33% of vol, VWAP $0.1023, 053.5% buys
$0.1029-$0.1039: 934896 shrs, 31.22% of vol, VWAP $0.1031, 089.1% buys
$0.1040-$0.1049: 268000 shrs, 08.95% of vol, VWAP $0.1040, 052.2% buys
$0.1049-$0.1059: 311910 shrs, 10.42% of vol, VWAP $0.1051, 023.4% buys
$0.1060-$0.1065: 277000 shrs, 09.25% of vol, VWAP $0.1060, 023.8% buys
$0.1070-$0.1075: 053299 shrs, 01.78% of vol, VWAP $0.1071, 018.8% buys
$0.1099-$0.1099: 166900 shrs, 05.57% of vol, VWAP $0.1099, 094.0% buys
$0.1100-$0.1190: 026250 shrs, 00.88% of vol, VWAP $0.1113, 075.2% buys
Some day-to-day VWAP changes, with the end date shown and the percentage change from the prior day. Buy percentage is the last value on each line.
01/10 $0.1052 +02.77% 57.8%
01/13 $0.1034 -01.76% 19.5%
01/14 $0.0993 -03.94% 31.8%
01/15 $0.0973 -02.02% 14.6%
01/16 $0.0964 -00.89% 34.8%
01/17 $0.1004 +04.15% 62.5%
01/21 $0.0997 -00.75% 51.7%
01/22 $0.0998 +00.10% 30.0%
01/23 $0.0937 -06.05% 27.6%
01/24 $0.0947 +01.08% 24.0%
01/27 $0.0925 -02.34% 35.6%
01/28 $0.0908 -01.82% 17.5%
01/29 $0.0914 +00.60% 30.2%
01/30 $0.0946 +03.55% 09.6%
01/31 $0.0997 +05.33% 53.9%
02/03 $0.1038 +04.14% 55.6%
Using the new 80% calculation 1/3 onward. This week's daily estimated values (older dailys in prior EOD posts in prior blog) for next share issue:
02/03: 20 lowest intra-day VWAPs in 40 days avg, $0.0973, x 80%: $0.0779
Vol in K, for above days: 2174.20.
Week ending summaries of PIPE financing estimated 85% share pricing, "Dly Sht % of 'sells'", and inflection points here are in the latest daily post above.
01/31/2014: EOD stuff partially copied to the concentrator.
# Trds: 239, MinTrSz: 100, MaxTrSz: 75000, Vol: 2600482, AvTrSz: 10881
Min. Pr: 0.0920, Max Pr: 0.1130, VW Avg. Tr. Pr: 0.0997
# Buys, Shares: 142 1401406, VW Avg Buy Pr: 0.1011
# Sells, Shares: 90 1123601, VW Avg Sell Pr: 0.0975
# Unkn, Shares: 7 75475, VW Avg Unk. Pr: 0.1057
Buy:Sell 1.25:1 (53.89% "buys"), DlyShts 1141107 (43.88%), Dly Sht % of 'sells' 101.56%
I think today was essentially a continuation of yesterday - selling into strength - but with more strength indicated by increased volume, buy percentage and VWAP. Caution may still be warranted by the behavior of the more active market-makers on the sell side. Using past behavior as a guide, along wit the continuation of the more active MMs on the sell side to behave much as the have in the past, I've decided my course is a jaundiced eye on the action until more consistent change in behavior occurs.
Today's low, high, VWAP, trade volume, and daily short sales moved 1.21%, 14.37%, 5.33%, 135.44% and 440.95% respectively. Price spread today was 22.83% vs. 8.69%, 10.25%, 1.43%, 13.00%, 4.73%, 44.79%, 14.26%, 31.25% and 5.76% on prior days.
There were two trades that were notable: $0.1129 x 13,136 and $0.1130 x 20K. The next highest is $0.11 and had quite a few trades and some volume, ~141.2K. If we remove then, our high drops to $0.11 (11.34% instead of 14.37%) and our spread becomes 19.57% instead of 22.83%.
48 of 239 trades, 20.08%, were >= 15K today. They represented 50.17% of the day's volume and had a VWAP of $0.0999, well above the $0.0905 VWAP of the ~1.425MM shares traded in smaller blocks. The largest block was 75K.
On the traditional TA front I'm leaning bearish, but can't have conviction in it. It's really just my feeling based on past action of the MMs without strong indications countering that.
We closed above my descending resistance (a nice change!), ~$0.098 AFAICT, at $0.0999. It was still below my long-term descending resistance of ~$0.11, but the high exceeded it if we include those two high-priced trades. Without them, we stopped right at it. Still a nice change overall. The accumulation/distribution continues to show strong and increasing distribution. But RSI, MFI, ADX stuff, full stochastic, momentum and Williams %R all strengthened. Bollinger bands have gone flat now at $0.1064 and $0.0889. RSI, MFI and Williams %R are at essentially neutral readings now, which is n improvement, and full stochastic is right at oversold and trying to come out of that area.
I could get all giddy here if I didn't recall my warning not to get suckered by the spike to $0.139 on 1/21. Today was also a spike, but it is different in that we did have some volume at and around the higher price levels today. So, did that exhaust buyers, or sellers, at these levels? Don't know yet. The 10, 20 and 50-day SMAs, $0.0949, $0.0977 and $0.1047 respectively, are still descending. They are based on close, IIRC, and could be expected to still be doing this with only today's close substantially above recent ranges. So their descent can't really be used to engender strong confidence that a bear sentiment is still in play.
The average of the lowest 20 VWAPs times 80% today is #0.0779 vs. $0.0780, $0.0783, $0.0787, $0.0792, $0.0797, $0.0801, $0.0805, $0.0806 and $0.0808 on prior days. 80% of today's VWAP is $0.0797 vs. $0.0757, $0.0731, $0.0727, $0.0740, $0.0758, $0.0750, $0.0798, $0.0797 and $0.0803 on prior days. These are potential prices for the next tranche of shares to the PIPErs. N.B. I'll have to keep an eye out for JP's calculations to see when the issues and true-ups end.
Yesterday I noted that in regard to daily short sales, that low buy percentage is not generally associated with low daily short sales and the day's 9.6% "buys" was low while the daily short percentage, 19.1%, was a bit higher than I would expect.
Well, today we got back on script - unusually high buy percentage of 53.9%, which is really strong relative to recent history, and daily short percentage of 43.88%, which is something in the area I would expect. It also fits the script in that today's high reading is lower than the two prior high readings in what I felt was the beginning of a leg down. Of course, lots of changes - price range, buy percentage - interjected themselves and maybe it's not going to stick to the script. We'll see after a few days.
ARCA's behavior was normal upon their entry to the sell side around 10:58 with an offer of $0.095, undercutting the $0.0989 best offer. Also normal was their exit at 11:03 and return at 11:18 with a $0.095 that undercut the $0.0988 best offer achieved during ARCA's absence. They left again by 11:51 and offers managed to move to $0.0989 before ARCA returned again at 11:52 with a $0.095 offer again. This in and out pattern continued until 14:36 when ARCA returned for good with a $0.0961 offer undercutting the $0.1048 in place at the time. The best seen had been as high as $0.105. For the rest of the day the offers mostly hung right in the $0.0999 to $0.10 range.
During the first half of the day bids were generally on a trend higher, +peaking at $0.10 at 13:35. They tended down to $0.096 at 14:32 and then recovered to as high as $0.0999 at 15:14. Through the day's end they stayed in the $0.0977 - $0.99 range.
I mentioned yesterday that it looked like the volatility in my original experimental calculations had started to return after a two-day respite. Yes, it continues with today's one-day readings improving in all six periods after yesterday's tendency towards increasing weakness. <*sigh*> The same is true for the change over five days. The rate of change over those days has one weaker and the rest better. All movements are small changes though, so I don't read anything much into them.
The newer version also has all periods showing one-day improvement just as it did yesterday. But the changes over a five-day period has only the two shortest periods improving, as does the rate of change over those five days. So volatility is back here too.
I had mentioned we'd started forming the pattern that could lead to a bullish call, but we had been there many times before with no completion. On the original, no such pattern. On the newer version, it's still trying, so we'll just have to stay tuned for further breaking news on the "whether" front.
As I've mentioned, with our current environment I don't know how useful these are.
Here's a trading breakdown by arbitrary time-frames, more detailed(?) than usual because of the unusual ARCA behavior today.
09:33-09:56: 043000 shrs, 01.65% of vol, VWAP $0.0988, 097.7% buys
10:19-10:56: 097495 shrs, 03.75% of vol, VWAP $0.0927, 014.7% buys
10:58-11:29: 352691 shrs, 13.56% of vol, VWAP $0.0961, 031.7% buys
11:30-12:29: 097209 shrs, 03.74% of vol, VWAP $0.0940, 073.3% buys
12:41-12:54: 102500 shrs, 03.94% of vol, VWAP $0.0944, 020.5% buys
13:04-13:10: 075889 shrs, 02.92% of vol, VWAP $0.0990, 000.0% buys
13:10-13:10: 044000 shrs, 01.69% of vol, VWAP $0.1031, 045.5% buys
13:10-13:12: 291111 shrs, 11.19% of vol, VWAP $0.1065, 067.4% buys
13:16-13:19: 044500 shrs, 01.71% of vol, VWAP $0.1050, 100.0% buys
13:21-13:26: 127500 shrs, 04.90% of vol, VWAP $0.0995, 066.7% buys
13:30-13:59: 540999 shrs, 20.80% of vol, VWAP $0.1006, 066.0% buys
14:02-14:27: 248600 shrs, 09.56% of vol, VWAP $0.1012, 039.7% buys
14:30-14:33: 091000 shrs, 03.50% of vol, VWAP $0.1027, 044.0% buys
14:34-15:02: 152488 shrs, 05.86% of vol, VWAP $0.0976, 059.3% buys
15:08-15:32: 071612 shrs, 02.75% of vol, VWAP $0.1000, 067.2% buys
15:33-15:50: 219888 shrs, 08.46% of vol, VWAP $0.0994, 073.4% buys
Here's a breakdown by arbitrary price range, more detailed than usual because of the unusual ARCA behavior today.
$0.0920-$0.0949: 176495 shrs, 07.25% of vol, VWAP $0.0928, 030.1% buys
$0.0950-$0.0955: 355208 shrs, 14.59% of vol, VWAP $0.0950, 020.7% buys
$0.0960-$0.0961: 275500 shrs, 11.32% of vol, VWAP $0.0960, 042.5% buys
$0.0975-$0.0977: 058500 shrs, 02.40% of vol, VWAP $0.0976, 000.0% buys
$0.0980-$0.0989: 216081 shrs, 08.88% of vol, VWAP $0.0985, 075.1% buys
$0.0990-$0.0999: 244888 shrs, 10.06% of vol, VWAP $0.0998, 067.9% buys
$0.1000-$0.1009: 496600 shrs, 20.40% of vol, VWAP $0.1001, 035.3% buys
$0.1010-$0.1016: 218500 shrs, 08.98% of vol, VWAP $0.1011, 085.6% buys
$0.1020-$0.1020: 107599 shrs, 04.42% of vol, VWAP $0.1020, 075.8% buys
$0.1049-$0.1050: 234500 shrs, 09.63% of vol, VWAP $0.1049, 100.0% buys
$0.1060-$0.1099: 042253 shrs, 01.74% of vol, VWAP $0.1073, 100.0% buys
$0.1100-$0.1100: 141222 shrs, 05.80% of vol, VWAP $0.1100, 053.6% buys
$0.1129-$0.1130: 033136 shrs, 01.36% of vol, VWAP $0.1130, 100.0% buys
Some day-to-day VWAP changes, with the end date shown and the percentage change from the prior day. Buy percentage is the last value on each line.
01/09 $0.1024 +01.40% 28.5%
01/10 $0.1052 +02.77% 57.8%
01/13 $0.1034 -01.76% 19.5%
01/14 $0.0993 -03.94% 31.8%
01/15 $0.0973 -02.02% 14.6%
01/16 $0.0964 -00.89% 34.8%
01/17 $0.1004 +04.15% 62.5%
01/21 $0.0997 -00.75% 51.7%
01/22 $0.0998 +00.10% 30.0%
01/23 $0.0937 -06.05% 27.6%
01/24 $0.0947 +01.08% 24.0%
01/27 $0.0925 -02.34% 35.6%
01/28 $0.0908 -01.82% 17.5%
01/29 $0.0914 +00.60% 30.2%
01/30 $0.0946 +03.55% 09.6%
01/31 $0.0997 +05.33% 53.9%
Using the new 80% calculation 1/3 onward. This week's daily estimated values (older dailys in prior EOD posts in prior blog) for next share issue:
01/27: 20 lowest intra-day VWAPs in 40 days avg, $0.0991, x 80%: $0.0792
01/28: 20 lowest intra-day VWAPs in 40 days avg, $0.0984, x 80%: $0.0787
01/29: 20 lowest intra-day VWAPs in 40 days avg, $0.0978, x 80%: $0.0783
01/30: 20 lowest intra-day VWAPs in 40 days avg, $0.0975, x 80%: $0.0780
01/31: 20 lowest intra-day VWAPs in 40 days avg, $0.0973, x 80%: $0.0779
Vol in K, for above days: 1886.79 1283.59 521.13 1104.53 2,600.48.
Week ending summaries of PIPE financing estimated 85% share pricing, "Dly Sht % of 'sells'", and inflection points here arein the latest daily post above.
01/30/2014: EOD stuff partially copied to the concentrator.
# Trds: 114, MinTrSz: 1, MaxTrSz: 100000, Vol: 1104532, AvTrSz: 9689
Min. Pr: 0.0909, Max Pr: 0.0988, VW Avg. Tr. Pr: 0.0946
# Buys, Shares: 18 106506, VW Avg Buy Pr: 0.0948
# Sells, Shares: 89 892526, VW Avg Sell Pr: 0.0944
# Unkn, Shares: 7 105500, VW Avg Unk. Pr: 0.0965
Buy:Sell 1:8.38 (09.64% "buys"), DlyShts 210945 (19.10%), Dly Sht % of 'sells' 23.63%
In conjunction with the ARCA oddity today, I highlight that from 12:39, one trade before ARCA started the oddity at 12:55, through EOD buy:sell was 1:9.55 (only 9.48% of that period's volume were "buys"). We ended the day at barely above that, as you can see above. Details far below for those with interest.
What we saw today, I think, is commonly termed "selling into strength", a common profit-taking and/or risk-reduction strategy. For little context, compare today's VWAP and volume in thousands, above, with a few recent days, oldest to most recent: $0.0937 2069.66, $0.0947 486.81, $0.0925 1886.79, $0.0908 1283.59 and $0.0914 521.13.
Today's low, high, VWAP, trade volume, and daily short sales moved 0.22%, -1.20%, 3.55%, 111.95% and 11.11% respectively. Price spread today was 8.69% vs. 10.25%, 1.43%, 13.00%, 4.73%, 44.79%, 14.26%, 31.25%, 5.76% and 8.33% on prior days.
There were four trades that were notable: $0.0969 x 13K, $0.0970 x 15K and 12K, and $0.0988 x 165. The first three are in range of prices seen at volume ($0.0968) and have some volume themselves, so I don't think discounting them is rational. That 165 share trade is a different story though. If we remove it, our high drops to $0.097 (-3.00% instead of -1.20%) and our spread becomes 6.71% instead of 8.69%.
11 of 114 trades were >= 15K today. Their pricing was not exceptional (removing them dropped VWAP only 1/100th of a penny). One of the blocks was 100K @ $0.963, just a bit above the midpoint of the day's range. Nothing else worth examining there.
On the traditional TA front, nothing has really changed. We still seem to be unable to break above the medium-term descending resistance, currently ~$0.0985 as near as I can tell. The accumulation/distribution continues to show strong distribution, MFI and ADX stuff weakened a small amount, and RSI is flat. Full stochastic is still oversold, but has flipped up, and momentum made a small tick up to ~0.91. The lower Bollinger bands continue to move lower.
Nothing strongly suggestive of big price moves here.
The average of the lowest 20 VWAPs times 80% today is $0.0780 vs. $0.0783, $0.0787, $0.0792, $0.0797, $0.0801, $0.0805, $0.0806, $0.0808 and $0.0815 on prior days. 80% of today's VWAP is $0.0757 vs. $0.0731, $0.0727, $0.0740, $0.0758, $0.0750, $0.0798, $0.0797, $0.0803 and $0.0771 on prior days. These are potential prices for the next tranche of shares to the PIPErs. N.B. I'll have to keep an eye out for JP's calculations to see when the issues and true-ups end.
Regarding daily short sales, being unaware of the odd behavior that would occur today, I said "If it sticks to the script, tomorrow should be a swing lower with a reading well above that 7.69%, but below (as a SWAG) 35%". Early on in the day I was looking for something in the area of 20% or so, based on the price and buy:sell activity. As the odd activity appeared I began to suspect I'd be way off, but had no idea by how much. As it turns out, the script was followed regardless as we ended with a ~19% value, reasonably well-centered between the prior two days' 7.69% and 36.43%. ~22% would've been the magic value.
There's an off-script component to this though - low buy percentage is not generally associated with low daily short sales. Today's 9.6% "buys" is low while the daily short percentage is a bit higher than I would expect from today's buy percentage. All I can guess is that the action of ARCA today influenced some folks, that didn't hold shares in accounts owned by the market-makers, to decide to sell "on the spur of the moment" or that MMs knowing that price would retreat from the peak mid-afternoon (13:57-14:44 - see the trading breakdown and ARCA commentary below), sold short knowing they would get covering buys at lower prices today (or soon, if they didn't cover today). Likely a combination of scenarios.
ARCA was a big deal, and both the same and very different from normal today!
"The same" is seen with ARCA's entry to the sell side around 11:04 with an offer of $0.091, undercutting the $0.0919 that had been in place about an hour. Also normal was their exit at 11:20 and return at 12:38. During this interval, the offer went immediately back to $0.0919 and prior to ARCA's return managed to get as high as $0.0988 and trades went off as high as $0.0949 and $0.0969 at the 12:38 mark. ARCA return then with a $0.094 offer, undercutting the then-best $0.0988. Again normal, ATDF and ARCA skirmished, driving offers down to $0.0929 at 12:55.
It looked like another normal day was in store for us. But then the "very different from normal" kicked in!
ARCA has appeared on the bid (buy side) a few times off and on in the past, usually either at very low bid point or only briefly or both. Today they came in at 12:55 hell-bent to buy with a bid of $0.0929, best the best bid of $0.0911 then and matching the best offer from ARCA on the sell side!
ARCA then exited the sell side at 13:05 and before they exited the buy side at 13:10, we had a small number and volume of trades go off at $0.0929-$0.0939. Oddly enough (yeah, right) from ARCA's exit from the sell side at 13:05 (not to return until 14:16 with an offer of $0.097) to their exit on the buy side at 13:10, eight trades (seven sells and one unknown) totaling 50K shares traded at a VWAP of $0.0932. But they weren't done.
Offers settled at $0.0949 and bid settled, again, at $0.0911 until ...
At 13:19, when best bid was again $0.0911, ARCA returned with a bid of $0.0939 when the sell-side offer was $0.0949. Over the next 14 minutes they battled with THEMSELVES (I didn't see any other MM bids move during this time - next best remained $0.0911) and pushed the bid up to $0.096 by 13:33. They weren't as successful, volume-wise, this time - only five trades, four sells and one buy, totaling 18.5K at an average VWAP of $0.0948 went off. Still, the price movement was successful.
And this activity did have another beneficial effect - the offers moved up. By 13:31 offer had moved from that $0.0949 to $0.0968, +2%!
Well, ARCA on the buy side couldn't let that terrific $0.0968 price (prior three days' VWAPs were $0.0925, $0.0908 and $0.0914) slip away! They moved their bid to $0.0967 at 13:57 (offer was $0.0968 then) and $0.0968 at 14:10 (offer was $0.0969 or $0.097 then).
The stage was set.
At 14:16, when the offer was $0.099, ARCA appears on the sell side with a $0.097 offer. At 14:42 ARCA exits the buy side, never to return. I posted a comment at 14:32 about the shares ARCA must have absorbed here.
ARCA stayed on the sell side rest of the day. They can now cause buying and selling, even having to walk the price down, eventually hitting $0.092 at 15:54, at much better average prices than were seen recently. Here's a summary of their offers.
14:44 $0.096x10K, 14:47 $0.095x10K, 14:58 $0.094x10K, 15:01 $0.0939x10K ATDF/$0.094x10K ARCA, 15:05 $0.094x10K, 15:09 $0.0945x10K, 15:13 BA $0.0944x10K ATDF/$0.0945x10K ARCA, 15:21 $0.0945x10K, 15:51 $0.094x10K, 15:54 $0.092x10K ARCA.
I had mentioned that my original experimental calculations continue to shed some of the volatility and two days of a predominate slight weakening trend had ended with marginal improvement on the one-day changes, along with the aggregate five-day changes and rate of change for all periods. It's BAAACK!
After just one day of improvement, we have deterioration again in all periods on the one-day changes. Maybe the one-day changes should be ignored? I don't know yet. They aggregate five-day change has a three and three split. The two shortest periods, five and ten-day, improved though along with the 100-day period. The rate of change over those days has only the 5 and 25-day periods weakening. That's hopeful I guess.
The newer version, which considers factors beyond just buy ratio and volume, has all periods showing one-day improvement, as do the changes over an aggregate five-day period and the rate of change over those five days. Unfortunately, they are not (yet?) of sufficient strength, duration and consistency to make bullish signal. But we do, again, have the early formations that may lead to a signal.
We've been there many times before with no completion though.
As I've mentioned, with our current environment I don't know how useful these are.
Here's a trading breakdown by arbitrary time-frames, more detailed(?) than usual because of the unusual ARCA behavior today.
09:53-10:08: 126600 shrs, 11.46% of vol, VWAP $0.0912, 000.0% buys
10:08-11:05: 114519 shrs, 10.37% of vol, VWAP $0.0910, 000.0% buys
11:13-12:37: 055789 shrs, 05.05% of vol, VWAP $0.0911, 036.0% buys
12:38-13:08: 074800 shrs, 06.77% of vol, VWAP $0.0936, 030.7% buys
13:09-13:31: 028900 shrs, 02.62% of vol, VWAP $0.0942, 017.3% buys
13:33-13:51: 152000 shrs, 13.76% of vol, VWAP $0.0961, 009.9% buys
13:57-14:44: 502731 shrs, 45.52% of vol, VWAP $0.0967, 005.0% buys
15:21-15:32: 003993 shrs, 00.36% of vol, VWAP $0.0944, 100.0% buys
15:53-15:58: 041700 shrs, 03.78% of vol, VWAP $0.0919, 034.1% buys
Here's a breakdown by arbitrary price range, more detailed than usual because of the unusual ARCA behavior today.
$0.0909-$0.0919: 339408 shrs, 30.73% of vol, VWAP $0.0912, 005.9% buys
$0.0920-$0.0929: 054500 shrs, 04.93% of vol, VWAP $0.0926, 026.1% buys
$0.0939-$0.0939: 018900 shrs, 01.71% of vol, VWAP $0.0939, 000.0% buys
$0.0944-$0.0949: 023993 shrs, 02.17% of vol, VWAP $0.0948, 079.2% buys
$0.0960-$0.0960: 137567 shrs, 12.45% of vol, VWAP $0.0960, 000.4% buys
$0.0963-$0.0967: 130999 shrs, 11.86% of vol, VWAP $0.0964, 006.5% buys
$0.0968-$0.0968: 359000 shrs, 32.50% of vol, VWAP $0.0968, 005.3% buys
$0.0969-$0.0988: 040165 shrs, 03.64% of vol, VWAP $0.0970, 062.7% buys
Some day-to-day VWAP changes, with the end date shown and the percentage change from the prior day. Buy percentage is the last value on each line.
01/08 $0.1010 -00.21% 32.8%
01/09 $0.1024 +01.40% 28.5%
01/10 $0.1052 +02.77% 57.8%
01/13 $0.1034 -01.76% 19.5%
01/14 $0.0993 -03.94% 31.8%
01/15 $0.0973 -02.02% 14.6%
01/16 $0.0964 -00.89% 34.8%
01/17 $0.1004 +04.15% 62.5%
01/21 $0.0997 -00.75% 51.7%
01/22 $0.0998 +00.10% 30.0%
01/23 $0.0937 -06.05% 27.6%
01/24 $0.0947 +01.08% 24.0%
01/27 $0.0925 -02.34% 35.6%
01/28 $0.0908 -01.82% 17.5%
01/29 $0.0914 +00.60% 30.2%
01/30 $0.0946 +03.55% 09.6%
Using the new 80% calculation 1/3 onward. This week's daily estimated values (older dailys in prior EOD posts in prior blog) for next share issue:
01/27: 20 lowest intra-day VWAPs in 40 days avg, $0.0991, x 80%: $0.0792
01/28: 20 lowest intra-day VWAPs in 40 days avg, $0.0984, x 80%: $0.0787
01/29: 20 lowest intra-day VWAPs in 40 days avg, $0.0978, x 80%: $0.0783
01/30: 20 lowest intra-day VWAPs in 40 days avg, $0.0975, x 80%: $0.0780
Vol in K, for above days: 1886.79 1283.59 521.13 1104.53.
Week ending summaries of PIPE financing estimated 85% share pricing, "Dly Sht % of 'sells'", and inflection points here are in the latest daily post above.
Disclosure: I am long AXPW.
Additional disclosure: I am very experimental and sometimes do my TA in non-traditional fashions. Keep this in mind when considering anything I post and be sure and consult other sources and do your due diligence. I'm barely responsible for myself and certainly not responsible for anyone else or their actions. :-)