ETF trading strategies that follow market momentum are popular and have been shown to provide high returns with reduced risk. I have written about one such system that rotates between an S&P 500 ETF and a long bond ETF based on which has performed the best in the recent past. Another system involves rotating a highly diversified basket of ETFs based on their recent price performance. Both of these systems showed market-beating performance with reduced risk in a 10-year backtest.
Alternative trading strategies attempt to go against the grain by scooping up short term price spikes that deviate from normal price behavior. This kind of trading, known as swing trading, generally operates on a far shorter time frame than momentum trading, requires more frequent trading, and often poses more risk of drawdown.
The system proposed in this article involves trading long and short positions of a single ETF based on short-term price spikes.
Principles of swing trading
Momentum trading relies on the principle that money follows money, and investors like to chase winners. Trends, however, never follow a straight line. Swing trading attempts to scoop up the deviations from the mean by buying during short-term dips, when the ETF is said to be oversold," and selling short during short-term highs, when the ETF is said to be "overbought."
There are many ways of attempting to determine whether an ETF's price is overbought or oversold. The Relative Strength Index, Stochastic Oscillators and the like are well known tools for attempting to measure the "out-of-normalness" of an ETF's price.
The current system in this article relies on recent intraday highs and lows to generate trading signals that detect relatively strong, short-term upward or downward price movements. These price swings can indicate a short-term price spike away from the trend, with the expectation that the price will revert to the mean in a short amount of time.
The basis of the proposed trading system
The trading system proposed in this article calculates an exponential moving average (EMA) of the intraday highs, an EMA of the intraday lows, and an EMA of the daily closes of one ETF. The difference between the EMA of highs and the EMA of lows is calculated as an average daily range.
A percentage is then calculated to determine where the EMA of closes sits within in the daily range relative to the highs. For example, assume the EMA of highs is 50 and the EMA of lows is 40. If the EMA of closes is 45, then the system will generate a percentage of 50% because the EMA of closes falls in the middle of the daily range. If the EMA of closes was 43 in the example above, then the system will generate a percentage of 70%. If the EMA of closes was 48.3, then the system will generate a percentage of 17%, and so on. A lower percentage means the EMA of closes is nearer to the EMA of highs.
As the EMA of highs, lows, and closes fluctates over time, the percentage generated by the system will also fluctuate. When the percentage is high, this means an upward spike has occurred, because the closes are at the high end of the daily range. When the percentage is low, this means a downward spike has occurred , because the closes are at the low end of the daily range.
Implementing the trading system
Once the percentage is calculated as discussed above, implementation of the system is simple. When the percentage is greater than a certain value, i.e., price has fallen, then go long the ETF. When the percentage is below a certain value, i.e., price has risen, go short the ETF.
An example of the trading system: MDY
I tested this system on MDY using 3-day EMAs and assuming a $20 commission per trade on an initial principle amount of $50,000.
I arbitrarily chose 50% as the threshold for long trades and 25% as the threshold for short trades. If the system's calculated percentage was greater than 50%, we would go long MDY. If it was lower than 25%, we would go short MDY. We exit the long trades whenever the percentage falls below 50% (because price has risen back to the mean) and we exit the short trades whenever the percentage falls above 25% (because price has fallen back to the mean).
Initial results were good, as shown below:
The system as applied to MDY since January 2, 1996 (50% long, 25% short):
| System | MDY | |
| Total | 9.19 | 6.90 |
| CAGR | 12.79% | 11.05% |
| Stdev | 13.77% | 22.66% |
| Sharpe | 0.93 | 0.49 |
| MaxDD | 21.90% | 55.33% |
| Linearity | 12.54% | 16.01% |
| Growth R | 1.02 | 0.69 |
The linearity and growth ratio factors are custom parameters that are described here. In short, they measure how close the system tracks to an ideal compounded growth curve.
While the returns are about the same as buying and holding MDY during the test period, we can see that the risk we paid for those returns was much lower. Standard deviation, a measure of volatility, is only a little more than half of MDY, and the maximum drawdown of 22%, compared to over 55% for MDY, if quite favorable.
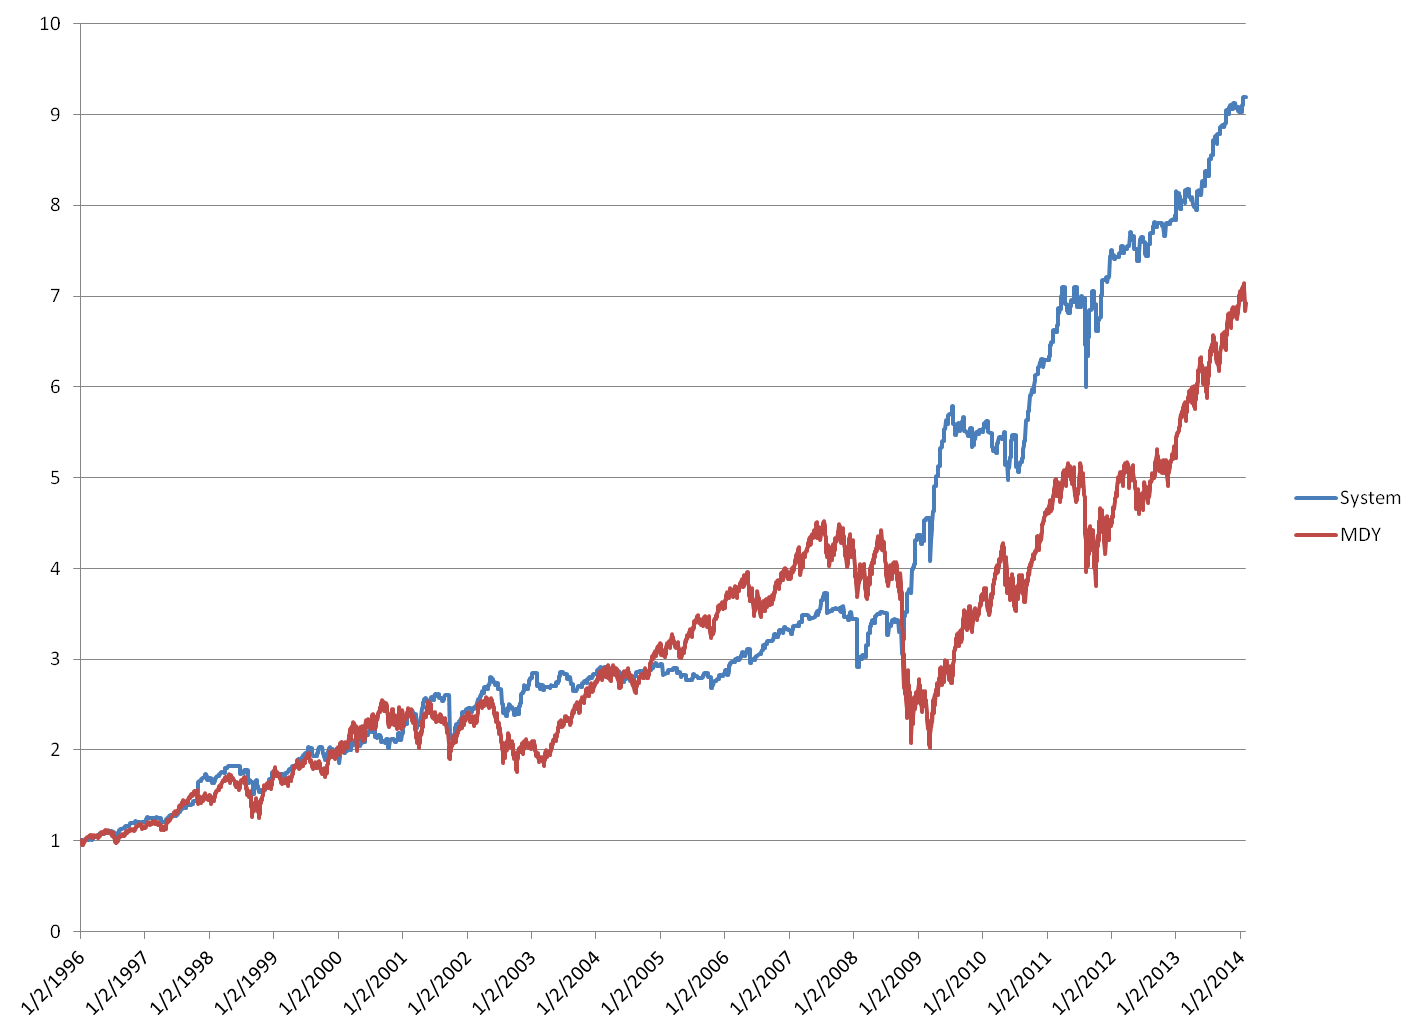
The system's performance versus MDY is shown in the graph below, generated from the author's spreadsheet.
System performance vs. MDY since January 1, 1996 (50% long, 25% short):
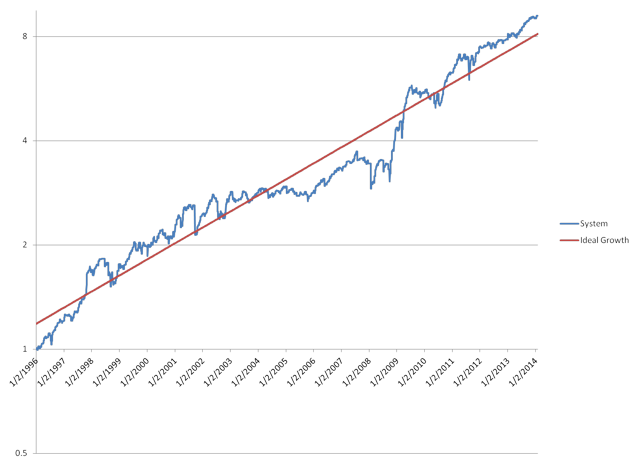
The system's performance on a logarithmic scale compared to an ideal growth curve is below, also generated from the author's spreadsheet.
LN(System performance) vs. ideal growth curve since January 1, 1996 (50% long, 25% short):
These results are pretty good, as they show a far better risk/return ratio than holding the MDY ETF itself as shown by the Sharpe ratio of 0.93 (versus 0.49 for MDY).
The system was improved when the threshold for the long position was reduced to 35%. This is not all that surprising, given the long term upward trend in the market (S&P 500 average CAGR is about 10% over the past 50 years). The results with this parameter reflect improved performance and even further reduction in proportional risk:
| System | MDY | |
| Total | 16.50 | 6.90 |
| CAGR | 16.43% | 11.05% |
| Stdev | 15.73% | 22.66% |
| Sharpe | 1.04 | 0.49 |
| MaxDD | 27.02% | 55.33% |
| Linearity | 8.90% | 16.01% |
| Growth R | 1.85 | 0.69 |
With the 35%/25% thresholds for long and short trades, the performance of the system versus MDY is shown below. A Sharpe ratio of greater than 1.0 is very good for any trading system and over twice as high as simply holding MDY.
System performance vs. MDY since January 1, 1996 (35% long, 25% short):
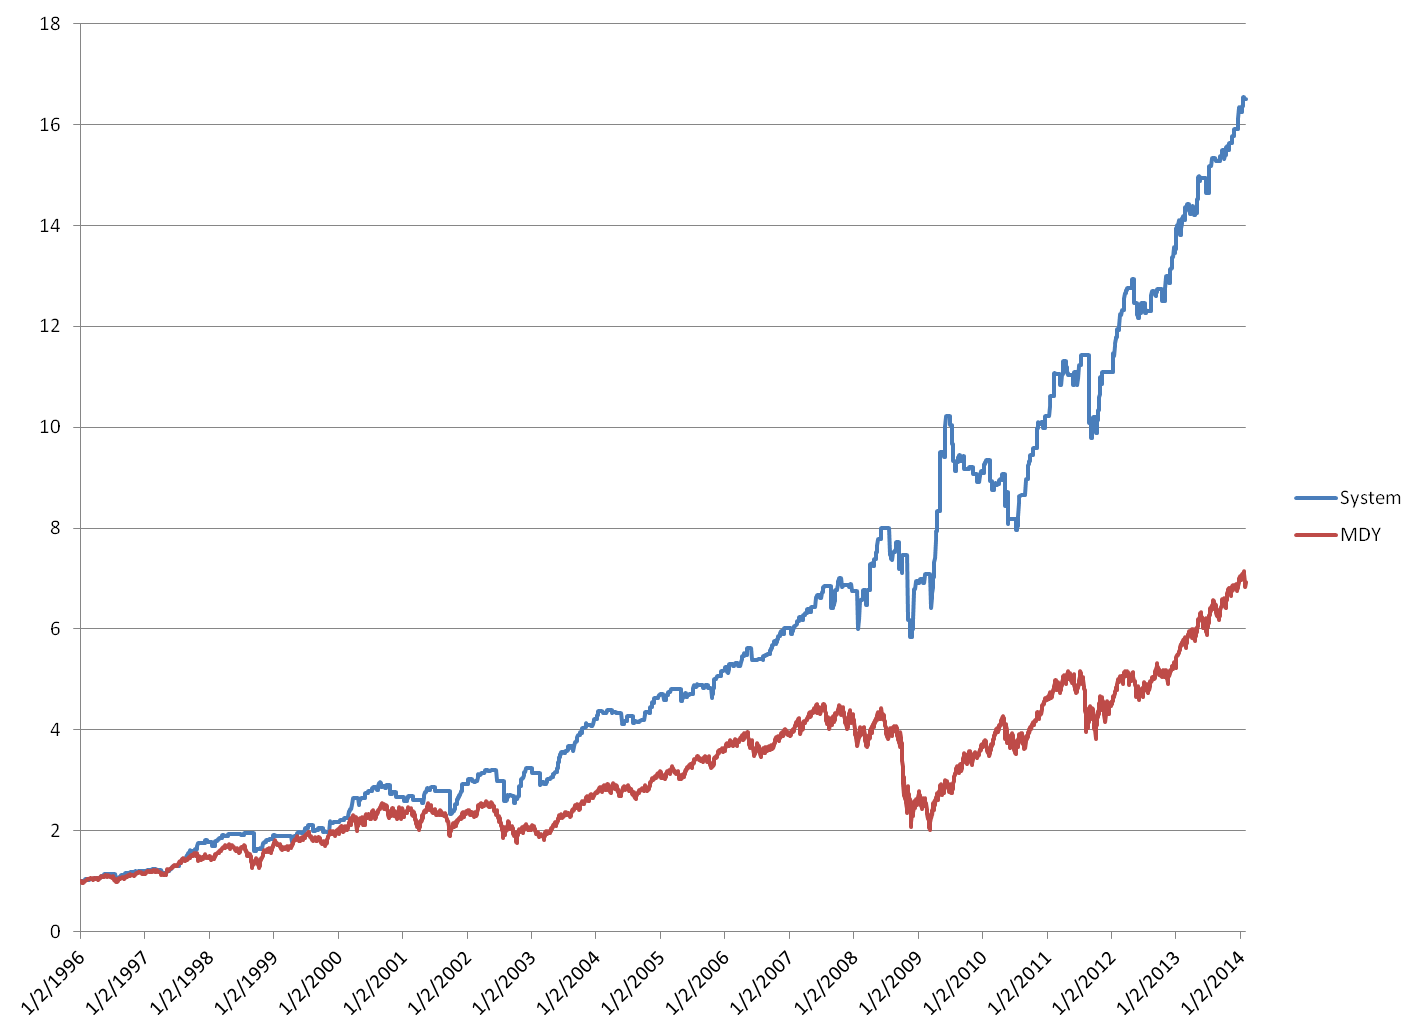
Now we see that the system beats the market from the beginning of the test period and continues to outperform. Compared to an ideal growth curve, performance is quite uniform:
LN(System performance) vs. ideal growth curve since January 1, 1996 (35% long, 25% short):
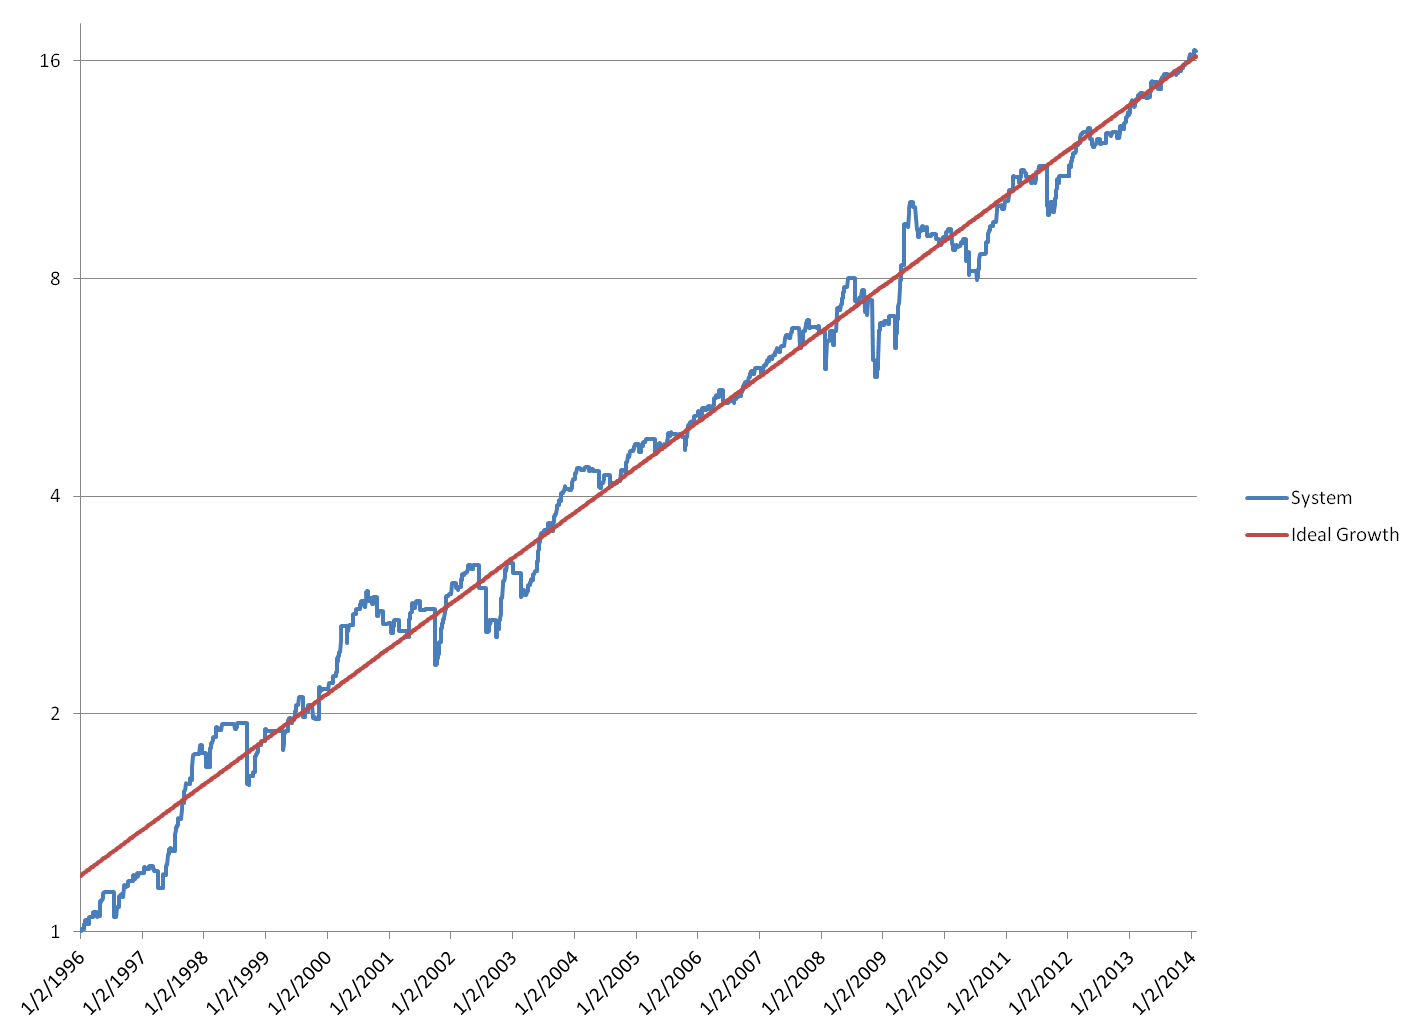
The uniformity of this curve is reflected in the low linearity value of only 8.9%. According to the laws of normal distribution, the linearity of 8.9% means that about 70% of the time, the system is less than 8.9% from the ideal growth curve. Compared to MDY's linearity of almost 20%, the system in this article provides far lower volatility than buying and holding the underlying ETF.
Although the system's CAGR of 16.5% is not much higher than MDY's CAGR of 11.2%, the significantly higher Sharpe ratio means that most of the benefits of this system are derived from the reduction in volatility and drawdown compared to buying and holding the underlying ETF.
The annual performance of the system compared to MDY is shown in the table below.
| As of | SYSTEM | MDY | delta |
| 1/2/1997 | 19.74% | 15.77% | 3.98% |
| 1/2/1998 | 46.48% | 31.77% | 14.70% |
| 1/4/1999 | 7.66% | 18.12% | -10.45% |
| 1/3/2000 | 13.75% | 13.08% | 0.67% |
| 1/2/2001 | 23.40% | 14.25% | 9.15% |
| 1/2/2002 | 9.62% | 3.11% | 6.51% |
| 1/2/2003 | 7.09% | -11.75% | 18.83% |
| 1/2/2004 | 34.52% | 31.46% | 3.06% |
| 1/3/2005 | 11.84% | 14.31% | -2.47% |
| 1/3/2006 | 11.23% | 15.41% | -4.18% |
| 1/3/2007 | 14.52% | 8.47% | 6.04% |
| 1/3/2008 | 12.29% | 5.19% | 7.10% |
| 1/2/2009 | 2.37% | -33.79% | 36.16% |
| 1/4/2010 | 31.71% | 35.66% | -3.95% |
| 1/3/2011 | 12.42% | 25.39% | -12.97% |
| 1/3/2012 | 8.55% | -2.22% | 10.78% |
| 1/2/2013 | 25.70% | 19.74% | 5.96% |
| 1/2/2014 | 16.51% | 27.98% | -11.47% |
In 12 out of 18 years, the system beat the market. But even more impressive is that the system did not have a down year in the 10-year backtest. This is a result of the lower volatility provided by the system's trades.
Evaluation across multiple parameters
The author evaluated the system's CAGR and Sharpe ratio across several values of the long and short percentage thresholds, as shown in the table below.
CAGR / Sharpe ratio of MDY for various long/short threshold valuessince January 1, 1996:
| LONG | 25% | 30% | 35% | 40% | 45% | 50% | 55% | 60% |
| SHORT | ||||||||
| 0% | 12.93% / 0.83 | 11.98% / 0.77 | 14.55% / 0.95 | 13.62% / 0.92 | 13.62% / 0.97 | 10.97% / 0.83 | 6.16% / 0.54 | 4.72% / 0.49 |
| 5% | 12.93% / 0.83 | 11.98% / 0.77 | 14.55% / 0.95 | 13.62% / 0.92 | 13.62% / 0.97 | 10.97% / 0.83 | 6.16% / 0.54 | 4.72% / 0.49 |
| 10% | 12.86% / 0.83 | 11.90% / 0.76 | 14.47% / 0.95 | 14.83% / 0.91 | 13.54% / 0.97 | 10.89% / 0.82 | 6.08% / 0.54 | 4.64% / 0.48 |
| 15% | 12.84% / 0.83 | 11.88% / 0.76 | 14.45% / 0.94 | 13.51% / 0.91 | 13.51% / 0.96 | 10.86% / 0.81 | 6.04% / 0.53 | 4.60% / 0.47 |
| 20% | 13.61% / 0.87 | 12.65% / 0.80 | 15.25% / 0.99 | 14.32% / 0.95 | 14.31% / 1.01 | 11.65% / 0.87 | 6.78% / 0.59 | 5.31% / 0.54 |
| 25% | 14.75% / 0.93 | 13.78%/ 0.86 | 16.43% / 1.04 | 15.48% / 1.01 | 15.48% / 1.07 | 12.79% / 0.93 | 7.85% / 0.66 | 6.35% / 0.62 |
| 30% | NA | 12.37% / 0.74 | 15.01% / 0.92 | 14.02% / 0.88 | 14.01% / 0.92 | 11.32% / 0.78 | 6.31% / 0.49 | 4.81% / 0.43 |
| 35% | NA | NA | 17.28% / 0.99 | 16.30% / 0.96 | 16.29% / 1.00 | 13.56% / 0.86 | 8.48% / 0.60 | 6.95% / 0.54 |
| 40% | NA | NA | NA | 14.88% / 0.82 | 14.87% / 0.85 | 12.14% / 0.71 | 6.96% / 0.45 | 5.43% / 0.38 |
| 45% | NA | NA | NA | NA | 14.20% / 0.75 | 11.48% / 0.62 | 6.26% / 0.36 | 4.73% / 0.29 |
| 50% | NA | NA | NA | NA | NA | 7.95% / 0.39 | 2.74% / 0.14 | 1.25% / 0.07 |
As the table shows, the results are robust across a large range of threshold parameters. If the long threshold is 45% or less, you will see better returns than holding MDY but with less volatility (higher Sharpe ratio). The optimal values of 35% long and 25% short may not be the best in all time periods, but they fall roughly within the middle of the ranges of acceptable values and thus feel the safest for use going forward.
Performance across multiple ETFs
The author also evaluated the system using these other ETFs: EEM,ILF, EPP, FEZ, and TLT as shown below.
System results for trading EEM (35% long 25% short) since August 28, 2003:
| System | EEM | |
| Total | 4.82 | 3.03 |
| CAGR | 15.70% | 10.81% |
| Stdev | 22.04% | 33.50% |
| Sharpe | 0.71 | 0.32 |
| MaxDD | 44.05% | 66.81% |
| Linearity | 14.26% | 22.05% |
| Growth R | 1.10 | 0.49 |
System results for trading ILF (35% long 25% short) since March 13, 2002:
| System | ILF | |
| Total | 7.66 | 5.06 |
| CAGR | 18.05% | 14.12% |
| Stdev | 25.13% | 34.10% |
| Sharpe | 0.72 | 0.41 |
| MaxDD | 50.69% | 67.48% |
| Linearity | 23.19% | 33.76% |
| Growth R | 0.78 | 0.42 |
System results for trading EPP (35% long 25% short) since March 13, 2002:
| System | EPP | |
| Total | 3.07 | 3.27 |
| CAGR | 9.57% | 6.64% |
| Stdev | 20.85% | 26.98% |
| Sharpe | 0.46 | 0.25 |
| MaxDD | 56.46% | 66.16% |
| Linearity | 14.24% | 20.62% |
| Growth R | 0.67 | 0.32 |
System results for trading FEZ (35% long 25% short) since March 6, 2003:
| System | FEZ | |
| Total | 3.94 | 2.25 |
| CAGR | 12.90% | 7.45% |
| Stdev | 23.48% | 29.49% |
| Sharpe | 0.55 | 0.25 |
| MaxDD | 55.20% | 66.17% |
| Linearity | 16.36% | 22.50% |
| Growth R | 0.79 | 0.33 |
System results for trading TLT (35% long 25% short) since December 11, 2002:
| System | TLT | |
| Total | 2.25 | 1.97 |
| CAGR | 7.31% | 6.06% |
| Stdev | 11.35% | 14.01% |
| Sharpe | 0.64 | 0.43 |
| MaxDD | 24.45% | 26.59% |
| Linearity | 11.98% | 7.10% |
| Growth R | 0.61 | 0.85 |
In each of the tables above, the system outperformed the a buy-and-hold of the underlying security in terms of return, volatility, and drawdown.
Conclusion
Swing trading short-term spikes of a single ETF based on moving averages of intraday highs and lows has been successfully backtested across a number of parameters and ETFs. Although past performance is of course no guarantee of future performance, the robustness of this proposal suggests that it is likely continue to outperform.
Disclosure: I am long EDV.