Market Moving News (Summary of 21 Articles)
Consumer spending gained 0.3% in February after rising 0.2% the month before. Store Sales continued soft last week.
Manufacturing continues a slow upward trend. Manufacturing growth so far in March is solid, based on Markit's PMI flash which is at 55.5, down from unusually high readings of 57.1 in February. Richmond Fed index remains in negative ground, at minus 7 vs February's minus 6. New factory orders for durables in February rebounded 2.2%, following a decrease of 1.3% in January. Outside of transportation, orders were up slightly but very mixed by subcomponents.
In the overall economy, data is indicating a soft 1st quarter, as in the 4th quarter. Real GDP growth for the fourth quarter was revised up slightly to an annualized 2.6% from the second estimate of 2.4% and compared to the third quarter's 4.1%. Expectations were for 2.7%. Personal income and spending growth were moderate in February while inflation remained nearly nonexistent. On a year ago basis, headline inflation was 0.9% in February versus 1.2% the month before. Core inflation on a year-ago basis held steady at 1.1%. The National Activity index moved into positive ground in February, to 0.14 from January's revised minus 0.45. However, the 3-month average sank into negative ground, at minus 0.18 from January's plus 0.02. This is the first negative reading in six months and points to a subpar economic trend.
Corporations are very healthy. Corporate profits in the fourth quarter posted at $1.905 trillion, compared to $1.869 trillion the previous quarter. Profits in the fourth quarter increased an annualized 7.9%, following a boost of 10.8% in the third quarter. On a year-on-year profits gained 6.0% versus 5.6% in the third quarter.
Jobs are improving. Initial claims fell 10,000 in the March 22 week to 311,000; the 4-week average is down a sharp 9,500 to 317,750, the lowest level in 6 months.
Housing is choppy. Home prices continue on a moderate uptrend. According to the FHFA, home prices gained 0.5% in January on a seasonally adjusted basis, following a 0.7% rise the month before. New home sales in February slowed, coming in at an annual rate of 440,000 vs a revised 455,000 in January. Supply has been thin in the housing market which has been a major factor holding down sales. The Mortgage Bankers Association purchase applications count rose 3.0% in the March 21; the refinance index fell 8%. Pending home sales have now fallen for 9 straight months.
Sentiment
Sentiment is mixed. Consumer confidence is higher than expected this month, at 82.3 vs a revised 78.3 in February and compared against the Econoday consensus for 78.4.
Michigan's Consumer sentiment report has held steady the last two weeks at a moderate level, at 80.0 vs a mid-month reading of 79.9 and vs a final February reading of 81.6. Details in the month-to-month comparison with February are mixed, showing no significant change for current conditions, at 95.7 vs 95.4, but a little weakness for expectations, at 70.0 vs 72.7. The decline in expectations may reflect disappointment over the jobs outlook.
The Bloomberg Consumer Comfort Index fell for a second week, to minus 31.5 in the period ended March 23 from minus 29 the week before. For the first time since early February, all three components of the gauge, which also includes measures of the buying climate and personal finances, decreased in the same week.
Confidence among institutional investors is strong, at 123.0 in March vs a revised 114.3 in February. Confidence is strongest in North America, at 125.5, with Europe and Asia lagging but still healthy, at 110.6 at 106.6 respectively.
The VIX
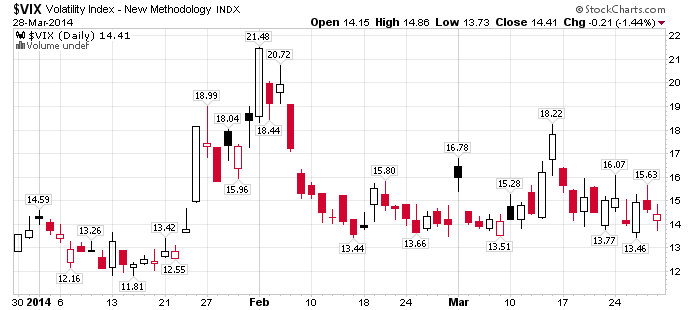
The VIX is showing little alarm, and has maintained its slightly elevated level as compared with the beginning of 2014.
The Market
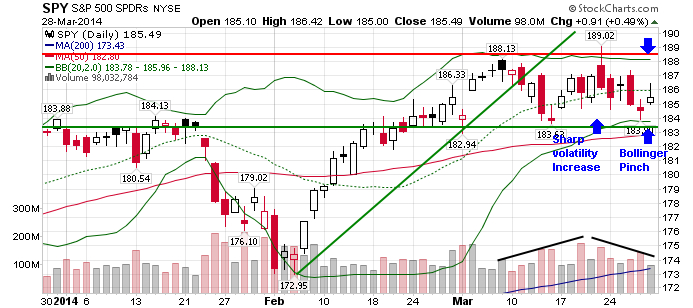
This week's charts carry lots of pattern information. In order of importance, the market is now trading between a weak support level around 183 and a strong resistance level at 188, volatility has sharply increased in the last three weeks, the Bollinger bands have pinched down, and volume has risen and fallen somewhat. The strong resistance is evidenced by a double top. Pinching Bollinger bands are a fairly reliable of a coming move in either direction, as happened on March 21, when two days later, the market moved sharply lower. The pinch reflects price consolidation resulting from indecision.
Small Caps
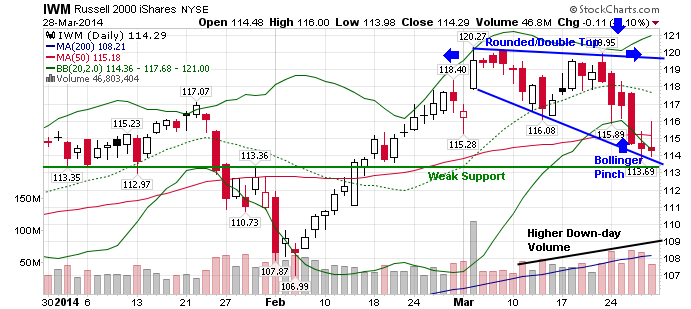
The small caps (IWM) are much weaker showing a more pronounced double top, and a rounded shape, indicating continuing deceleration of the prior trend, which is now in negative territory. Volatility, relative to the previous uptrend, is much higher. The rounded top is a bearish pattern suggesting a sharp break lower. The volatility also forms a poor version of a broadening top. The proper form would have the second high above the initial high. The pattern could move higher, and then break much lower. In any case, this chart is bearish, suggesting that minor news could touch off a large drop, probably to the 107 level. Since IWM is the average of 2000 stocks, the chart suggests broad market weakness.
Core Sectors
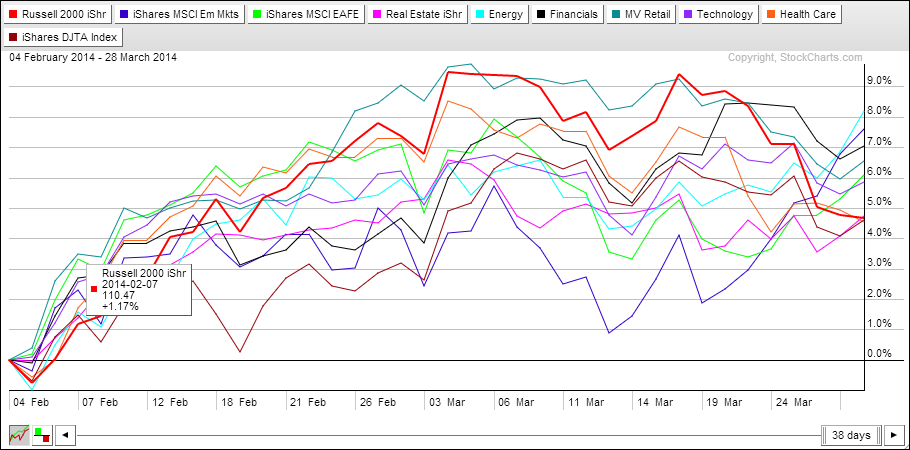
The core sector chart shows lots of leadership change at the end of a 38-day rally. Surprisingly, emerging markets (EEM) have been moving up in relative strength. The chart shows a 7-day rally to the top of a 3-month trading range. Energy (XLE) has risen to the leading position, as the IWM and healthcare (XLV) have fallen to the rear.
Highest Relative Strength
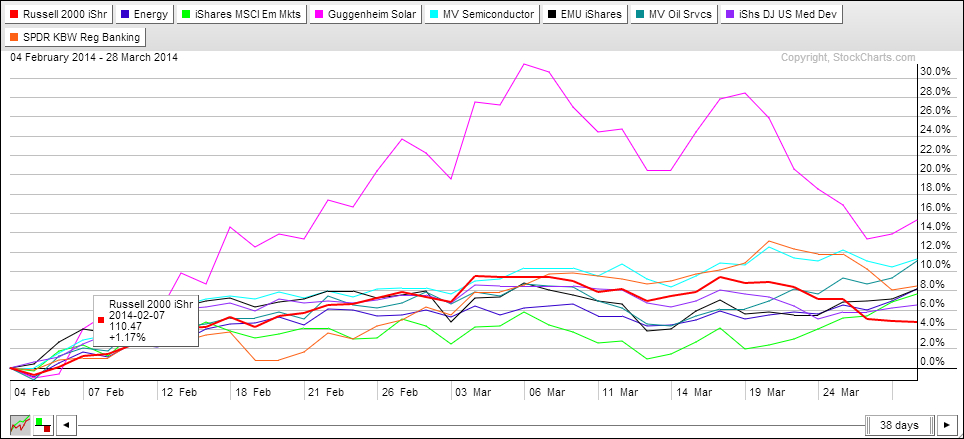
Of the 36 ETF's I follow, I selected eight that exceeded IWM in relative strength. One of the strongest through the recent volatile week is semiconductors (SMH). Solar companies (TAN) remain the strongest, but have had a huge drop from 28% to 14% above 38 days ago. TAN is 14% below its all-time high, and the sector may have bottomed, but is not likely to hold if the broader market tanks. Beyond these speculative ideas, nothing looks good.
Trades Last Week
I was on vacation, but had stops on my holdings. Only SMH managed to survive in my portfolio.
Sold: SSO, XLK, IWM, XLF, TAN
Conclusion and Action
A week ago, the market seemed to calm quickly after the Crimea caper. This weekend, Russia has massed large numbers of troops near the eastern Ukraine border, with enough logistics support to sustain an invasion. Late Friday, Putin called President Obama to discuss negotiating, but we know nothing further. An invasion could trigger a large sell-off.
The charts are bearish and the economy doesn't appear strong enough to sustain gains against the geopolitical risk, so I will wait and see what kind of support forms before reentering the market, at which time, I will buy IWM.
Have a great week!
Disclosure: I have no positions in any stocks mentioned, and no plans to initiate any positions within the next 72 hours.