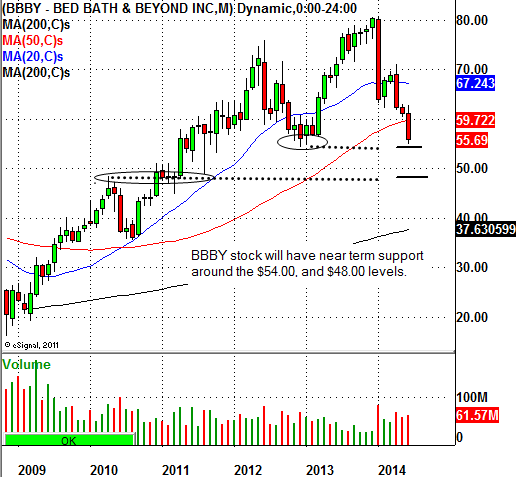
This morning, share of the home-furnishing retailer, Bed Bath & Beyond Inc (NASDAQ:BBBY) are getting slammed lower after reporting quarterly result that were lower than expectations. The popular retail stock is declining lower by $5.61 to $55.50 a share. Traders and investors should note that the stock is now trading below its important 50-week moving average. Anytime a stock falls below this critical moving average it is generally a sign of sharp institutional distribution. Traders will now have to look at the chart to find the next near term support area for the stock. In December 2012, Bed Bath & Beyond Inc stock traded as low as $54.33 before reversing and trading to new all time highs earlier this year. This tells us that the $54.00 area will be the next near term support level for the stock. Should that support level fail to hold Bed Bath & Beyond Inc stock will have more support around the $48.35 level. This support area was a break-out point in 2011. Often, past breakout points will serve as excellent support levels when retested.
Nick Santiago
InTheMoneyStocks.com