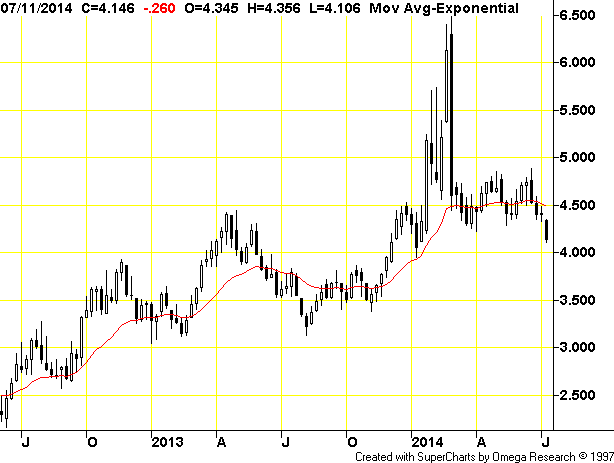
The above chart is a continuation weekly chart of Natural Gas Futures using the nearby contract. One will notice that we have been down for the last 4 straight weeks from a high of about $4.90 ($4.886) and a low of about $4.10. If you look at the chart you should notice that when we topped at nearly $6.50 the last week of February, Natural Gas futures fell for 4 straight weeks before starting a rebound. There are numerous other times on the chart where Natural Gas rallied after dropping for 3 or 4 weeks, and I believe we are very near a short-term bottom right now.
We are also near a nice big round number of $4.00 which should hold some significant support. The 2nd week of this year, we fell to $3.95 and then started the big march up to the multiyear highs above $6.00. If $4.00 does not hold support right now, $3.90 to $3.95 should hold support, at least long enough to get a 40 to 50 cent bounce likely.
We can also look to see what Natural Gas did in July 2012 and July 2013, to get a clue about the seasonal tendencies. We are starting the 3rd week of July in 2014 as I type. But looking at the 3rd week of July 2012 (7th bar on the chart counting from the left), one can see that Natural Gas rallied strongly and continued higher for another couple weeks. However, the month of August 2012 saw a retest of the recent lows and the real bottom did not occur until the first week of September 2012.
Looking at the 3rd week of July in 2013, that also was an up week, continuing the rally of the previous two weeks. However, a year ago the rally quickly faltered and Natural Gas futures then fell about 50 cents over the following 3 weeks, where it made a bottom in early August.
What these two prior years of data show is that we could and should now rally a bit in Natural Gas, over the next 1-3 weeks, but that we are likely going to get one more final selloff from early to late August. By September 2014, one definitely should be long Natural Gas futures or invested in the triple leveraged Natural Gas Commodity ETN (UGAZ). We can now take a look at the UGAZ daily chart:
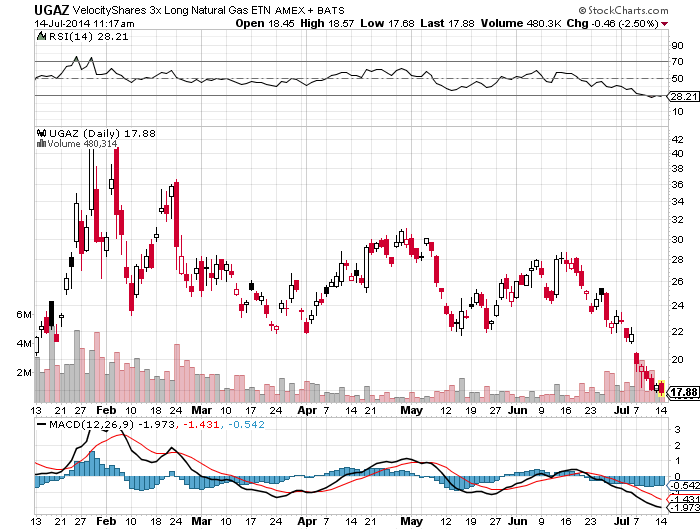
We are still trading today so UGAZ may or may not close below $18 today. However, I feel that buying UGAZ under $18 is an excellent buy in the short-term and long-term. If Natural Gas rallies 40 cents from current prices just above $4.10, that would be about a 10% gain in the futures and a 30% gain in UGAZ from just below $18 to maybe $23.30. During the month of August, I will be watching the price of Natural Gas futures closely and will look to buy UGAZ on dips. If one wants to follow the price of Natural Gas Futures, one can find the price at Barchart.com here or at the CME exchange website here.
Disclaimer:
The thoughts and opinions in this article, along with all stock talk posts made by Robert Edwards, are my own. I am merely giving my interpretation of market moves as I see them. I am sharing what I am doing in my own trading. Sometimes I am correct, while other times I am wrong. They are not trading recommendations, but just another opinion that one may consider as one does their own due diligence.