Market Moving News (Summary of 22 Articles)
Spending is strong. Same-store sales rose 0.6% in the August 23 week for a very strong year-on-year rate of plus 4.2%. Redbook's same-store sales tally came in at a year-on-year plus 4.0% in the August 23 week. Demand for back-to-school apparel was solid. New factory orders for durables soared a monthly 22.6% in July, following a 2.7% boost in June. Excluding transportation, durables orders slipped 0.8%, following a 3.0 boost in June. Transportation spiked a monthly 74.2% after rising 2.1% in June. Nondefense aircraft (Boeing) surged 318.0% (that is not a typo) after gaining 11.1% in June.
The overall economy is picking up, confirmed by the national activity index which rose to plus 0.39 in July vs a revised plus 0.21 in June. The 3-month average, at plus 0.25 vs June's revised plus 0.16, is over breakeven zero for a fifth month in a row. Growth in the nation's service sector remains strong but has moderated this month, to 58.5 vs 61.0. Second quarter GDP growth came in a little stronger than expected, rising 4.2% annualized versus a 4.0% forecast and coming off a 2.1% weather related drop in the first quarter.
Manufacturing slowed somewhat. The Chicago PMI moved from slight monthly expansion, 52.6 in July, to extreme monthly expansion for August, to 64.3. The August reading is the highest since a 65.5 spike in May. Corporate profits in the second quarter came in at $1.840 trillion, following $1.735 trillion for the first quarter. These numbers include annual revisions. Profits in the second quarter gained an annualized 26.5% after an 11.0% drop in the first quarter. Corporate profits on a year-on-year basis were up 4.5%, compared to 2.4% the prior quarter. Texas factory activity increased again in August, although at a slower pace than in recent months. The production index, a key measure of state manufacturing conditions, fell from 19.1 to 6.8. The new orders index fell 11 points to 2.2 after surging in July. Growth in Fed Kansas City District manufacturing activity slowed slightly in August, but producers' expectations for future activity remained solid.
Personal spending is down slightly. Personal income growth decelerated in July after two strong months. Personal income rose 0.2% in July after gains of 0.5% in both June and May. The wages & salaries component advanced 0.2% in July after increases of 0.4% in each of the prior two months. Personal spending unexpectedly declined 0.1% after jumping 0.4% in June. Durables fell 0.7% after increasing 0.5% in June.
Inflation is tame. PCE inflation slowed to a monthly 0.1% in July from 0.2% in June. The latest figure equaled expectations. Core PCE inflation posted at 0.1%-the same pace as in June. Analysts projected 0.1%.
Housing is getting stronger. More and more indications of improvement are coming out of the housing sector, now led by a very strong 3.3% rise in the pending home sales index to 105.9.Upward revisions offset a lower-than-expected 412,000 annual sales rate for new home sales in July with the two prior months revised higher by a total of 28,000. Supply on the market rose to 205,000 vs 197,000 in June, pulling up the monthly supply to 6.0 months at the current sales rate vs 5.6 in June. Home price appreciation improved in June according to FHFA with a rise of 0.4% in June, compared to 0.2% in May. But the year-ago rate is slowing to 5.1% from 5.3% in May. S&P Case-Shiller 20-city adjusted data show a 0.2% decline in June following a 0.3% gain in May. Year-on-year, the adjusted rate is plus 8.1% vs 9.3% in May.
Jobs continue to Improve. Initial jobless claims continue to move incrementally to lower levels pointing squarely to improvement underway in the labor market, moving 1,000 lower in the August 23 week to 298,000. The 4-week average is down 1,250 to 299,750. Continuing claims, which lag by a week, rose 25,000 in data for the August 16 week, but the 4-week average is down 4,000 to 2.524 million.
Sentiment
Sentiment readings are the strongest I've seen. Consumer confidence rose 2.1 points to a new recovery high of 92.4 reflecting a 6.7 point surge in the present situation component to 94.6. The gain in this component reflects improvement in August employment with substantially more consumers saying jobs are now plentiful, at 18.2% vs July's 15.6%, and a bit fewer saying jobs are currently hard to get, at 30.6% vs July's 30.9%.
Sentiment among global institutional investors is up a very sharp 7.0 points in August to a very strong 122.8. This month's strength is led by Asia, up nearly 10 points to 101.7 in a gain that reflects improved growth in China where a lack of inflation is raising expectations for continued monetary stimulus. Expectations for stimulus are also boosting sentiment in Europe where the index is steady at 127.7. North America is little changed at 110.3.
The Bloomberg Consumer Comfort Index rose to 37.3 in the week ended August 24 from 36.6 in the prior period. Views of household finances advanced to an almost four-month high and a gauge of whether it's a good time to shop also increased. The Bloomberg gauge of personal finances increased to 53.3 last week, the highest since the period ended May 4, from 51.5 in the previous survey.
Consumer sentiment is up in the final August reading, to 82.5 vs 79.2 at mid-month and vs 81.8 in final July.
VIX
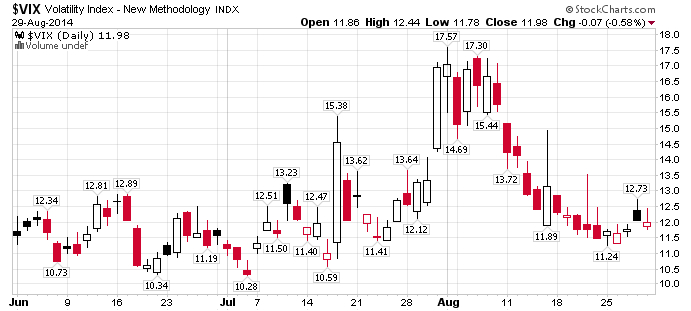
The VIX popped higher Thursday on geopolitics, but remains in the "complacent" range. The VIX expresses serious concern when it rises over 20.
The Market (S&P500)
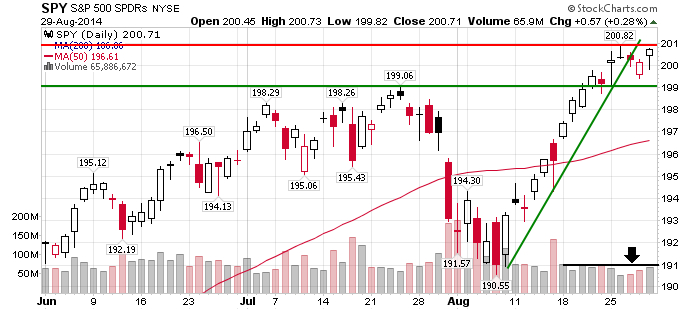
The S&P 500 had a volatile week that touched an all-time high of 201, and fell back a couple of points on geopolitical issues. Volume was quite light ahead of Friday, which was the last day of the month.
Small Caps (IWM)
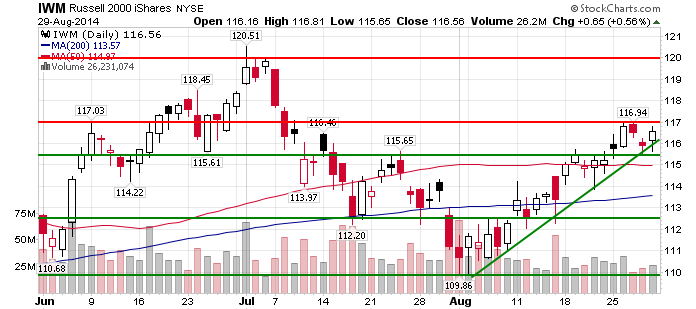
Small caps showed greater strength than the S&P 500 as indicated by the strong gain on Tuesday, but likewise reacted to geopolitics on Thursday and Friday.
Core Sectors
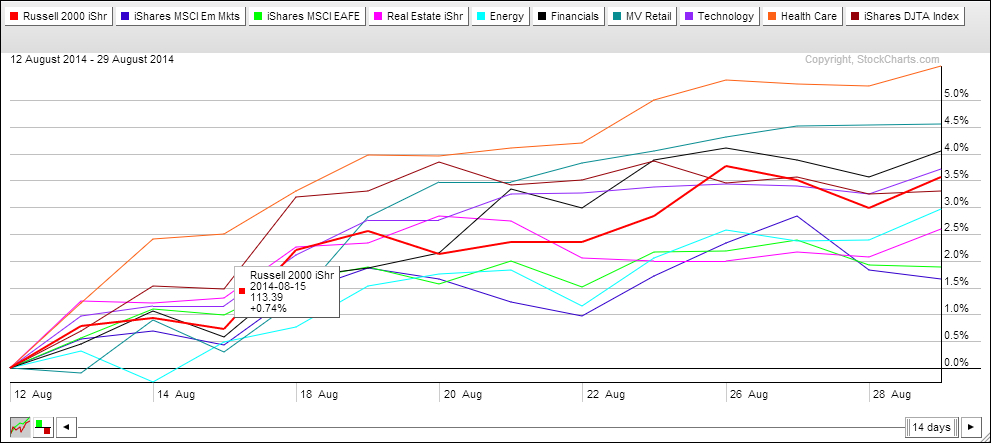
This market is not uniformly robust. The core sector chart shows weakness in four of the ten sectors. The Russell 2000 (IWM) gain in relative strength vs. energy(XLE), real estate (IYR), foreign large caps (EFA), and emerging markets (EMM). The strongest sector is healthcare (XLV), followed by retail (RTH), Finance (XLF), tech, and transportation (IYT).
Best Relative Strength
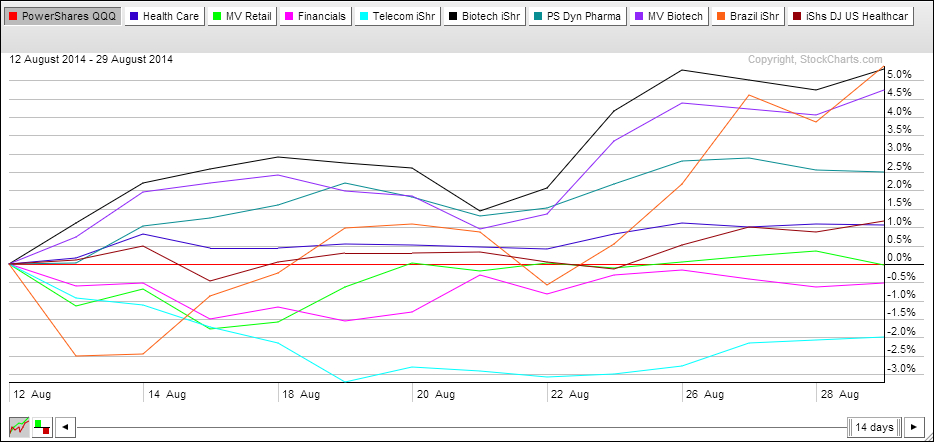
As has been the case for months, the Nasdaq 100 (QQQ) remains the strongest index, continuing to outperform continues to out-perform SPY and IWM, so the chart above compares the strongest ETF's to the QQQ's. Leaders in order on the above chart are Biotech (IBB), Brazil (EWZ), and Biotech (BBH). There is a third, much more volatile biotech, (XBI), not shown. ETF's showing about the same relative strength as the Q's are pharma (PJP), Healthcare/pharma (XLV), Healthcare (IHF), retail, (RTH) and financials (XLF). Telecommunications (IYZ) has shown recent strength.
Trades Last Week
I was cautious last week because I expected a sell-off driven by European sanctions on Russia. The market started off strong, but volatility triggered tight stops.
Bought and Sold: BA, IAI, IWM, IYZ, QQQ, SSO, XBI, XLF, SLK, XLV
Holding: AGNC, IHF
Conclusion and Action
Last week was tough due to tight stops and volatility from Ukraine concerns. I would have fared better had I held all my positions. That said the market is narrowed, with fewer sectors having greater relative strength than Nasdaq 100, and the QQQ went flat last week. The IWM is in a more volatile base.
If you normally skip the news in this report, go back read the headlines. The economy is the strongest I've seen since before 2008, providing a strong rationale for the new highs in all market indices. Traders who believe the markets are propped up by the Fed are ignoring the obvious improvements in the U.S., China even Europe's economies. While the worst relative strength performer in the core list, the European Union ETF (EZU) has broken an uptrend and is volatile, but is not collapsing under the sanctions threat.
Although my instincts are to be cautious, I'm going to try loosening stops on strong sectors and stocks that I expect to be less affected by the Ukraine issue. Brazil (EWZ) is tempting.
Have a great week!