
Yesterday I speculated on more selling in stocks, showing one stock to consider shorting, STJ, St. Jude Medical.
I have been negative on oil and oil-related, European stocks, gold/silver stocks, and small- and mid-cap stocks for about a month. We're still negative on these, less negative on Europe than on the others.
There has been a strong jump up in Treasury yields -- does anyone believe the global economy is recovering? Or is this simply traders playing the understanding that the FED has to act now, has to let interest rates rise. Note the sudden strength of the US Dollar. Can interest rates rise during a depression? Well, they can if there is a depression and inflation at the same time, as there was 1965-1983, thanks to FED misunderstanding of reality or malfeasance.
___
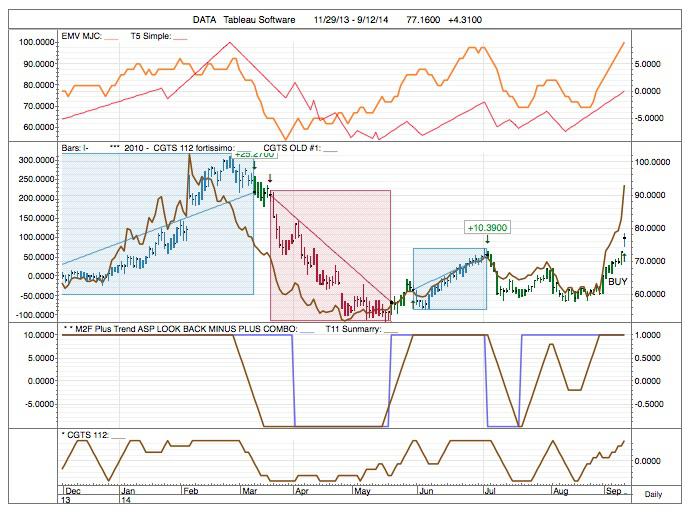
Today I want to show some stocks that might be good short-term trade long positions. Starting with DATA, Tableau Software. DATA looks set to rocket higher.
Note: all these trading systems are computer-generated and work with technical indicators I have created over the years.
In trading this with our CGTS112 Fortissimo trading system -- the primary driver of this system is CGTS 112, brown line in bottom pane -- trading has been pretty good: 5 winning trades, for an average gain of 19% in 31 trading days; 1 losing trade for less than 1% in 11 trading days.
Note how the CGTS Old #1 indicator is zooming straight up -- brown line, second pane down, overlaying price. This is an indication of major buyer strength swelling up.
Test Range: 6/13/13 to 9/12/14
Net P&L: 85.11
Percent Net P&L: 149.39%
Number of Trades: 6
Average P&L per Trade: 14.19
Percent Winning Trades: 83.33%
Total Days in Test: 300
Percent Days in Market: 55.00%
Average P&L per Day: 0.28
Max Drawdown: 9.44
Reward/Risk Ratio: 9.016
Buy & Hold P&L: 20.19
vs. B&H P&L: 64.92
vs. B&H Percent P&L: 113.95%
vs. B&H Reward/Risk Ratio: 8.578
Current Position: Long
Open Trade P&L: 0.00
Traded Last Day: Enter Long
18 dates at the beginning of this quote file were excluded from the test range because this trading model requires 18 data points before the first value can be calculated.
Entry Exit
# Type Bars Date Date P&L Pts P&L % Reason for Exit
_
1 Long 14 06/17/13 07/08/13 +6.11 +11.13 Exit Long Rule
2 Long 5 08/06/13 08/13/13 +11.56 +19.42 Exit Long Rule
3 Long 11 09/09/13 09/24/13 -0.58 -0.80 Exit Long Rule
4 Long 72 11/14/13 03/07/14 +25.27 +38.54 Exit Long Rule
5 Short 39 03/20/14 05/19/14 +32.36 +35.95 Exit Short Rule
6 Long 24 05/29/14 07/02/14 +10.39 +16.89 Exit Long Rule
7 Long 1 09/12/14 09/12/14 0.00 0.00 Open
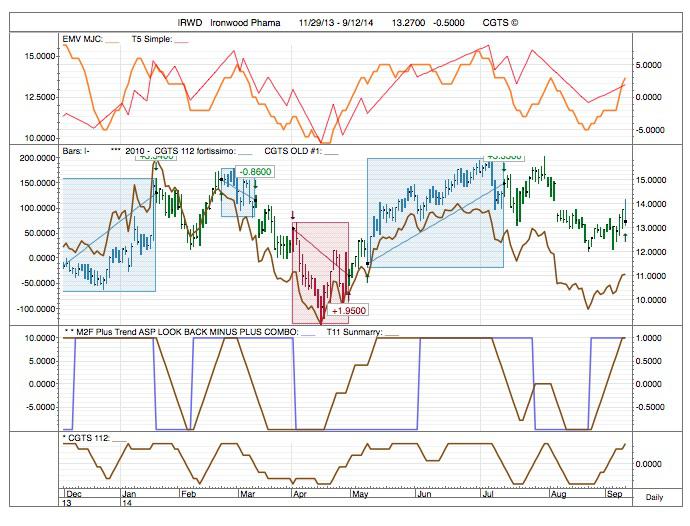
Next, IRWD, Ironwood Pharmaceuticals. This stock is giving a buy signal this weekend, also on the CGTS 112 Fortissimo system. It is not as dramatic a buy as DATA; but it has apparently bottom (see CGTS OLD #1, two panes from the top) and seems to want to move higher. CGTS 112 has hit its maximum +7 rung, which is one criteria for a buy signal (the trends also have to be right).
Test Range: 3/2/10 to 9/12/14
Net P&L: 40.92
Percent Net P&L: 301.99%
Number of Trades: 22
Average P&L per Trade: 1.86
Percent Winning Trades: 86.36%
Total Days in Test: 1120
Percent Days in Market: 59.91%
Average P&L per Day: 0.04
Max Drawdown: 3.07
Reward/Risk Ratio: 13.329
Buy & Hold P&L: -0.28
vs. B&H P&L: 41.20
vs. B&H Percent P&L: 304.06%
vs. B&H Reward/Risk Ratio: 13.358
Current Position: Long
Open Trade P&L: 0.00
Traded Last Day: Enter Long
18 dates at the beginning of this quote file were excluded from the test range because this trading model requires 18 data points before the first value can be calculated.
Entry Exit
# Type Bars Date Date P&L Pts P&L % Reason for Exit
_
1 Short 29 04/28/10 06/09/10 +3.34 +25.02 Exit Short Rule
2 Long 7 06/23/10 07/02/10 -1.29 -10.60 Exit Long Rule
3 Short 13 08/09/10 08/26/10 +0.82 +8.18 Exit Short Rule
4 Long 154 09/17/10 04/28/11 +4.29 +40.09 Exit Long Rule
5 Long 33 05/18/11 07/06/11 +1.29 +8.63 Exit Long Rule
6 Short 25 07/20/11 08/24/11 +1.88 +12.54 Exit Short Rule
7 Short 11 09/27/11 10/12/11 -0.06 -0.52 Exit Short Rule
8 Long 14 10/17/11 11/04/11 +1.52 +12.43 Exit Long Rule
9 Long 21 01/24/12 02/23/12 +0.97 +7.04 Exit Long Rule
10 Short 54 03/07/12 05/23/12 +1.40 +10.53 Exit Short Rule
11 Short 24 07/10/12 08/13/12 +1.94 +14.35 Exit Short Rule
12 Short 30 10/04/12 11/19/12 +1.73 +13.43 Exit Short Rule
13 Long 6 01/07/13 01/15/13 +1.42 +10.70 Exit Long Rule
14 Long 32 02/13/13 04/02/13 +3.81 +27.45 Exit Long Rule
15 Short 56 04/05/13 07/02/13 +7.75 +43.25 Exit Short Rule
16 Long 14 07/22/13 08/09/13 +0.55 +4.96 Exit Long Rule
17 Long 5 09/10/13 09/17/13 +0.20 +1.50 Exit Long Rule
18 Short 37 09/30/13 11/20/13 +1.60 +13.51 Exit Short Rule
19 Long 33 11/25/13 01/22/14 +3.34 +30.06 Exit Long Rule
20 Long 11 02/21/14 03/10/14 -0.86 -5.73 Exit Long Rule
21 Short 18 04/01/14 04/30/14 +1.95 +15.03 Exit Short Rule
22 Long 44 05/08/14 07/11/14 +3.33 +28.91 Exit Long Rule
23 Long 1 09/12/14 09/12/14 0.00 0.00 Open
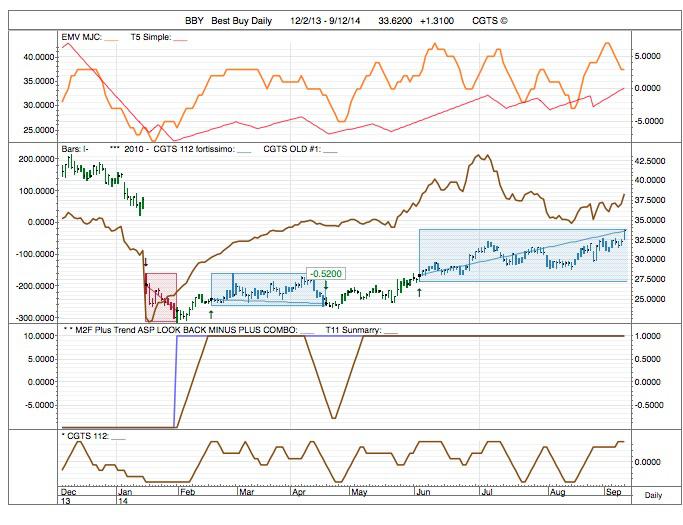
Another stock that looks interesting here is BBY, Best Buy. We bought this using the same system back in June, using the same system. It is up 20%. But the CGTS Old #1 indicator seems about ready to jump up again; so we think it is going higher.
Test Range: 1/29/01 to 9/12/14
Net P&L: 227.05
Percent Net P&L: 687.33%
Number of Trades: 45
Average P&L per Trade: 5.05
Percent Winning Trades: 75.56%
Total Days in Test: 3382
Percent Days in Market: 54.58%
Average P&L per Day: 0.07
Max Drawdown: 11.88
Reward/Risk Ratio: 19.112
Buy & Hold P&L: 0.59
vs. B&H P&L: 226.46
vs. B&H Percent P&L: 685.55%
vs. B&H Reward/Risk Ratio: 19.099
Current Position: Long
Open Trade P&L: 5.56
Traded Last Day: No
18 dates at the beginning of this quote file were excluded from the test range because this trading model requires 18 data points before the first value can be calculated.
Entry Exit
# Type Bars Date Date P&L Pts P&L % Reason for Exit
_
1 Long 8 01/29/01 02/08/01 -6.03 -18.26 Exit Long Rule
2 Long 27 04/12/01 05/22/01 +8.19 +25.01 Exit Long Rule
3 Long 19 06/28/01 07/26/01 +3.26 +7.72 Exit Long Rule
4 Short 27 08/14/01 09/27/01 +12.39 +30.43 Exit Short Rule
5 Long 66 10/12/01 01/17/02 +13.45 +38.08 Exit Long Rule
6 Long 4 03/15/02 03/21/02 +0.07 +0.13 Exit Long Rule
7 Short 71 05/01/02 08/12/02 +34.31 +69.57 Exit Short Rule
8 Long 5 09/16/02 09/23/02 -0.61 -3.78 Exit Long Rule
9 Short 2 10/08/02 10/10/02 +1.28 +9.49 Exit Short Rule
10 Short 1 11/11/02 11/12/02 -0.45 -3.85 Exit Short Rule
11 Long 12 11/25/02 12/12/02 +0.26 +1.52 Exit Long Rule
12 Long 129 01/10/03 07/17/03 +11.43 +62.55 Exit Long Rule
13 Long 75 08/18/03 12/03/03 +5.45 +16.59 Exit Long Rule
14 Long 22 04/05/04 05/06/04 -0.47 -1.29 Exit Long Rule
15 Long 65 08/25/04 11/26/04 +6.49 +19.78 Exit Long Rule
16 Long 66 05/04/05 08/08/05 +15.03 +43.84 Exit Long Rule
17 Long 26 10/25/05 12/01/05 +4.15 +9.32 Exit Long Rule
18 Long 57 01/18/06 04/10/06 +8.61 +17.73 Exit Long Rule
19 Short 21 05/18/06 06/19/06 -0.08 -0.15 Exit Short Rule
20 Short 14 07/17/06 08/04/06 -2.52 -5.50 Exit Short Rule
21 Short 222 10/27/06 09/18/07 +6.68 +12.34 Exit Short Rule
22 Short 11 01/11/08 01/29/08 -4.75 -10.75 Exit Short Rule
23 Short 22 02/22/08 03/26/08 +1.94 +4.39 Exit Short Rule
24 Short 19 06/26/08 07/24/08 +1.51 +3.77 Exit Short Rule
25 Short 43 09/23/08 11/21/08 +20.24 +53.45 Exit Short Rule
26 Long 46 12/12/08 02/20/09 +3.48 +14.25 Exit Long Rule
27 Long 16 03/19/09 04/13/09 +7.47 +22.25 Exit Long Rule
28 Long 17 07/22/09 08/14/09 +0.52 +1.45 Exit Long Rule
29 Long 39 10/15/09 12/17/09 +0.02 +0.05 Exit Long Rule
30 Long 46 02/25/10 05/07/10 +4.16 +11.28 Exit Long Rule
31 Short 31 05/27/10 07/14/10 +7.29 +17.26 Exit Short Rule
32 Short 13 08/19/10 09/08/10 -0.88 -2.69 Exit Short Rule
33 Long 51 09/13/10 11/23/10 +9.52 +27.47 Exit Long Rule
34 Short 85 12/08/10 04/12/11 +11.25 +27.02 Exit Short Rule
35 Short 6 06/10/11 06/20/11 -3.11 -10.94 Exit Short Rule
36 Short 54 07/19/11 10/04/11 +6.24 +21.50 Exit Short Rule
37 Short 29 04/10/12 05/21/12 +3.15 +14.77 Exit Short Rule
38 Short 7 07/18/12 07/27/12 +1.09 +5.78 Exit Short Rule
39 Short 60 08/29/12 11/27/12 +5.32 +29.21 Exit Short Rule
40 Short 8 12/27/12 01/09/13 -0.08 -0.70 Exit Short Rule
41 Long 53 01/22/13 04/09/13 +10.35 +67.25 Exit Long Rule
42 Long 137 05/02/13 11/22/13 +13.11 +49.92 Exit Long Rule
43 Short 10 01/16/14 01/31/14 +3.29 +12.26 Exit Short Rule
44 Long 37 02/18/14 04/16/14 -0.52 -2.08 Exit Long Rule
45 Long 66 06/03/14 09/12/14 +5.56 +19.81 Open
Generally losing trades with this system are kept small, which is one of our goals in all our trading systems. We want 90% accuracy in trading. That is an ambitious goal.
This is not our most accurate trading system. But it has been productive since we began developing it two months ago.
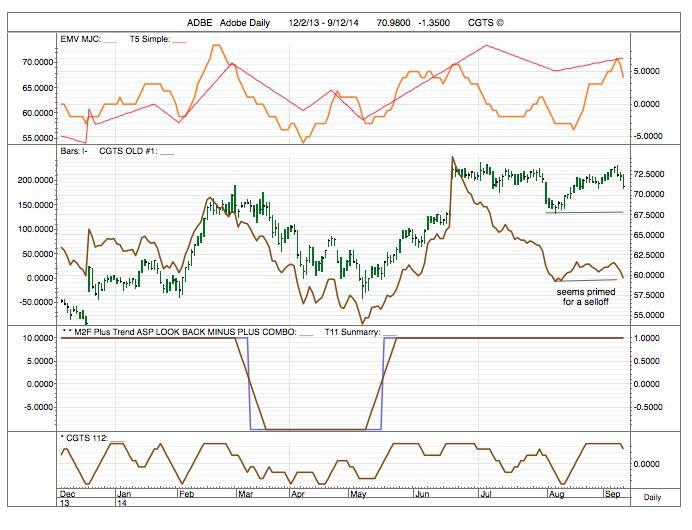
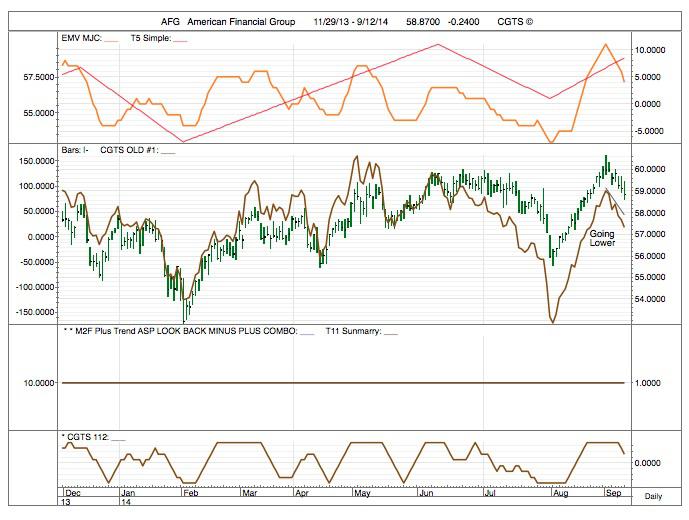
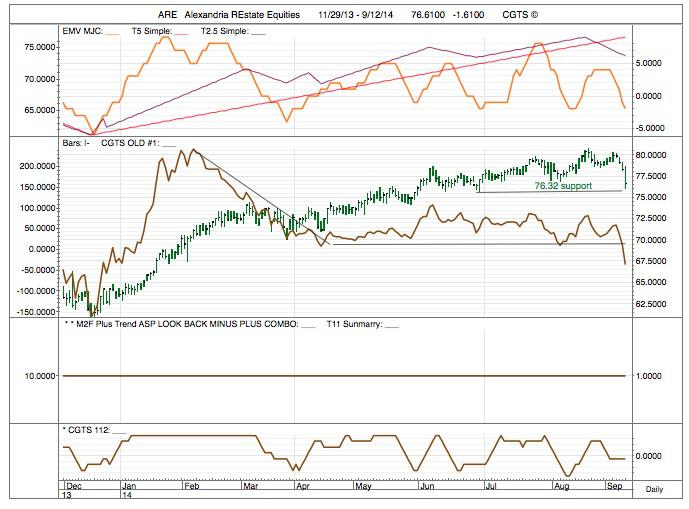
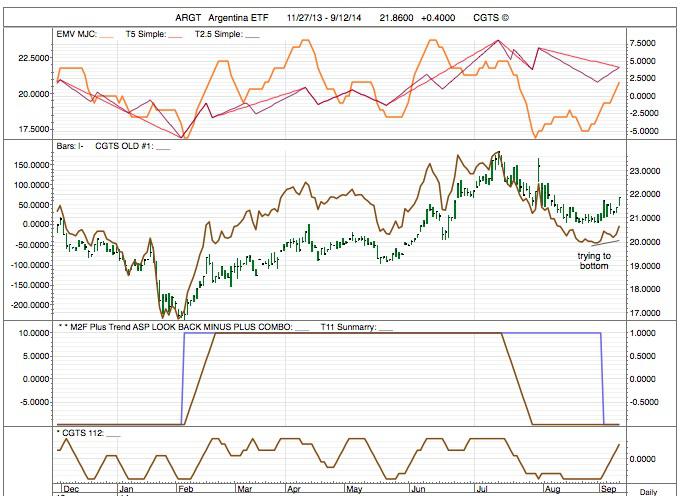
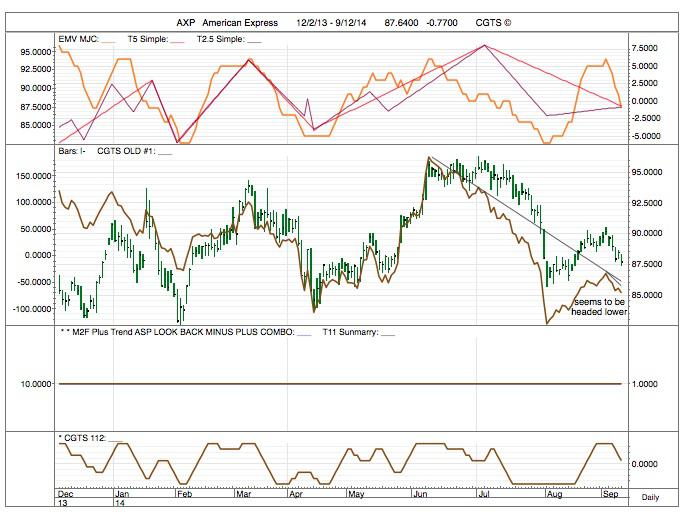
SUPPLEMENTAL CHARTS ISSUED WITHOUT COMMENT.
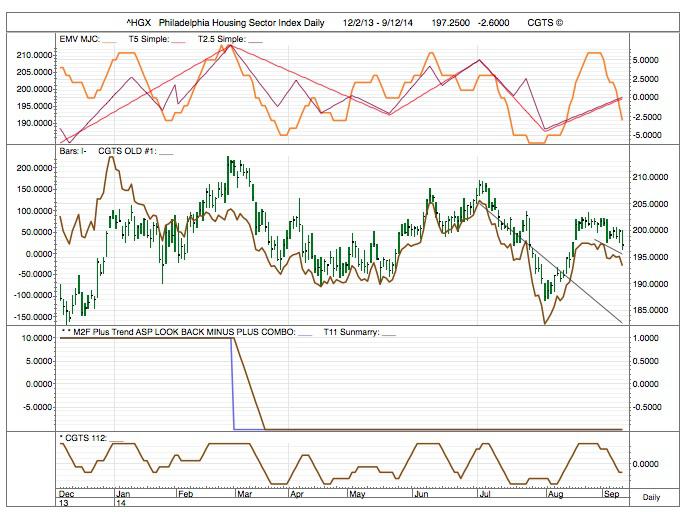
I will say that charts for AXP, American Express, and Housing, HGX, do not look good at this point.
Successful trading.
Michael J. Clark, CGTS
Eugene, Oregon
13 September 2014