After five straight weeks of gains, Wall Street ended lower by the end of last week's trade. Good economic news is once again bad news for the market. Solid U.S. retail data and rising bullish consumer sentiment added to concerns that the Fed could raise interest rates sooner than expected. That prospect caused benchmark U.S. bond yields to post their biggest weekly increase in over a year, and something like this can put the fear in the market real quick. But insiders' buying ticked up a notch, which helped to steady the market's wobbly behavior last week.
As some savvy market strategists have it, U.S. stocks are in a correction mode even though the engulfing bull market remains intact. The reason for this is that as different sectors in the market correct and prices come down, it attracts more buying to come into the market because there are few attractive alternatives to take the market's place.
Also, capital spending is finally emerging as an added incentive for new money to move into the market as companies are moving to replace aging infrastructure in order to boost productivity. While this has started a slight uptrend in interest rates, it is beginning to boost wage growth in the industrial sectors of the economy.
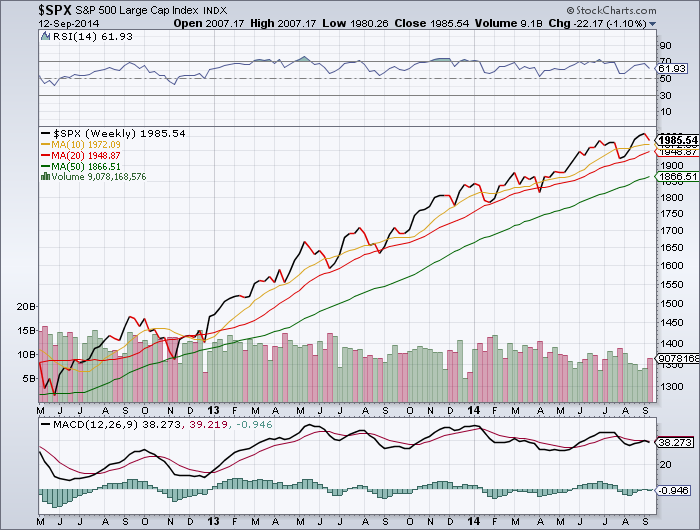
Check this large-cap weekly chart [SPX] and note that there is no doubt that the bull-market remains intact. This index's Moving Average lines configuration [green line below the red line] remains as bullish as it has been since June of 2011. But note that the MACD momentum index has been totally flat since early August, a sign that the internals of this bull [stocks, sectors] have turned negative while the bull-run continues to higher highs.
Also note that even though the RSI strength indicator has pulled back a bit, it still remains way up in its bullish territory. Put it all together, and it becomes clear that any pullback from here will be a buying opportunity.
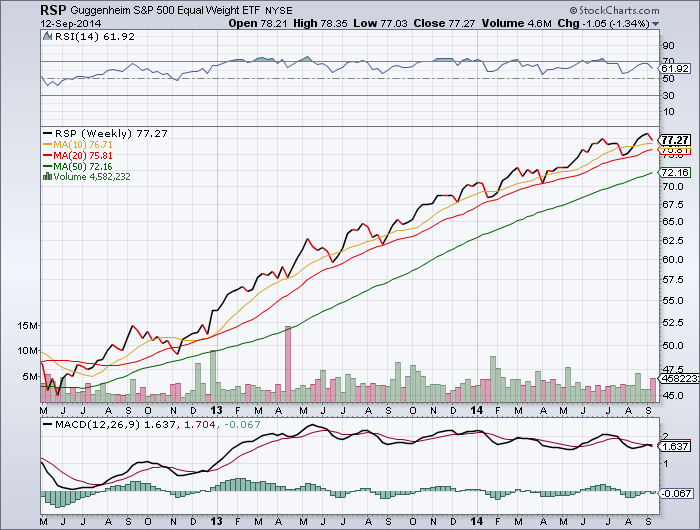
Check the weekly charts of the Troika and note that its two bull components [RSP] and [SPXL] both continue to sport bullish MA lines configurations [green lines below the red] meaning that all is well with this bull market. But with the MACD momentum bars inching into bearish territory south of the demarcation line, there are issues with the underlying stocks and sectors.
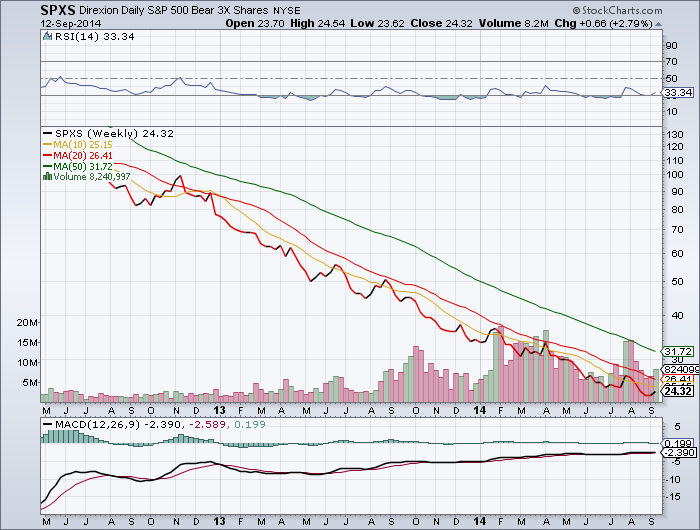
While this may have a negative impact on the market, check the weekly bear component of this Troika [SPXS] and note that there is not a bear in sight that could do real damage to this bull market. This bear's negative MA lines configuration [green line above the red] keeps burying itself deeper in a deep hole at the bottom of a deep pit. Its MACD momentum bars remain stuck in dead neutral on their demarcation line as they have been since early 2013. Meanwhile, the bear's RSI strength indicator has given up the ghost, all of which makes for a bullish environment for the stock market.
Yes, the individual sectors and stocks of this bull market are gearing up to some sort of a correction, and that would be a godsend to those investors who missed the gravy train and entry-point to this rally.

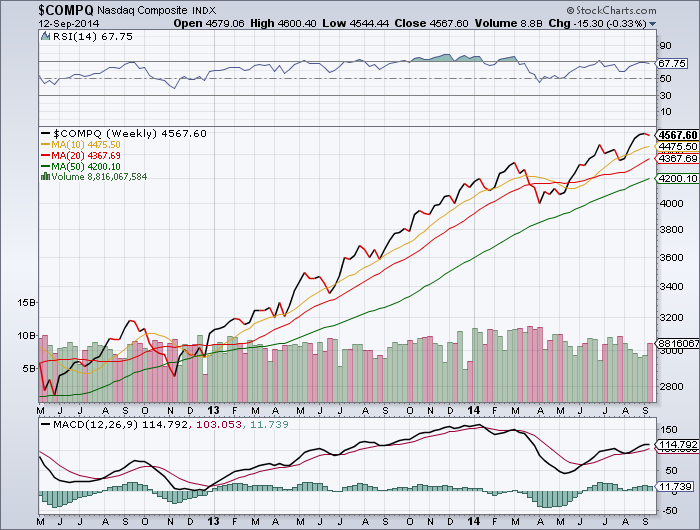
Check the weekly NASDAQ chart [COMPQ] and at first glance it becomes obvious that this index needs a rest and consolidates its gains. Although it shot up too high too fast, its MA lines configuration remains remarkably bullish [green line below the red.] Not only that, the MACD momentum index along with the RSI strength indicator remained well up in their respective bullish territories. The implication here is that technology, industrials and financials will be among the leaders during the next leg of this bull-run.
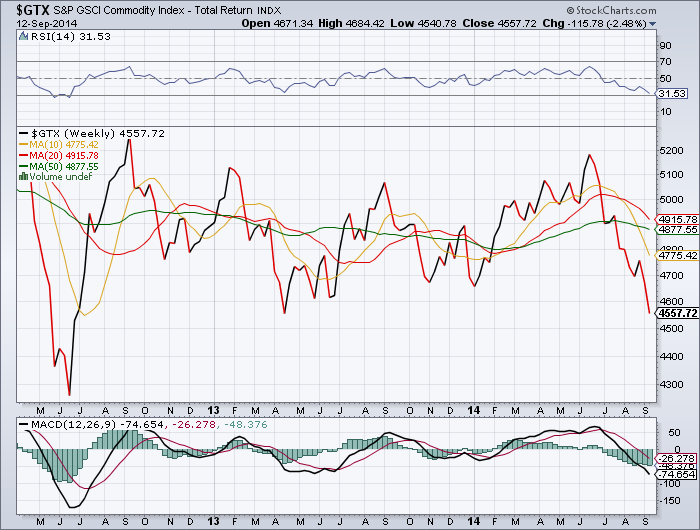
This weekly [GTX] chart reflects a commodity market mired in deep trouble. Although its MA lines configuration is still bullish [green line below the red] it is fading quickly. The MACD momentum bars are deep in bearish territory south of the demarcation line, and so is the RSI strength indicator. It is hard to see what could turn this thing around, but strong commodities are needed for this bull market to maintain its staying power.
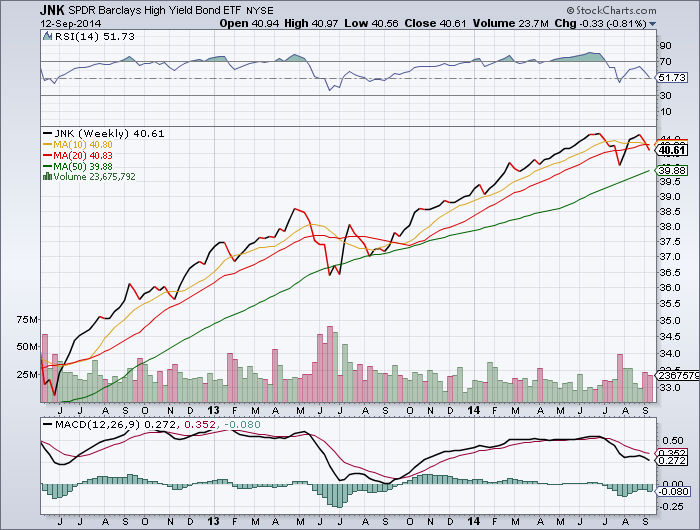
Although this market-forecasting junk-bond canary [JNK] continues to sport a strongly bullish MA lines configuration [green line below the red] the MACD momentum index and RSI strength indicator remain deep in their respective bearish territories.
This is another indication that while the major market remains bullish, the internal stocks and sectors have mainly turned bearish. That spells caution for investors until such time that these internals turn bullish also.
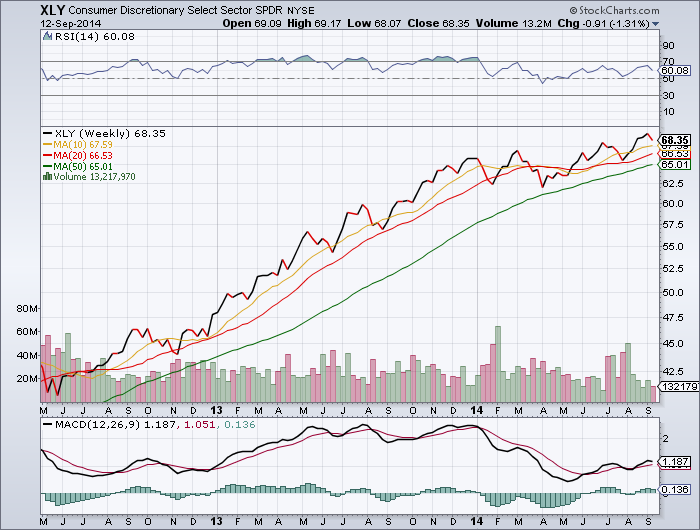
This consumer discretionary index [XLY] displays a bullish weekly chart for investors. The MA lines configuration [green line below the red] is bullish, and so are the MACD momentum index and RSI strength indicator both of which are well ensconced in their respective bullish territories.
The implication here is that the cyclical, economic sensitive sectors of the market are gathering strength.
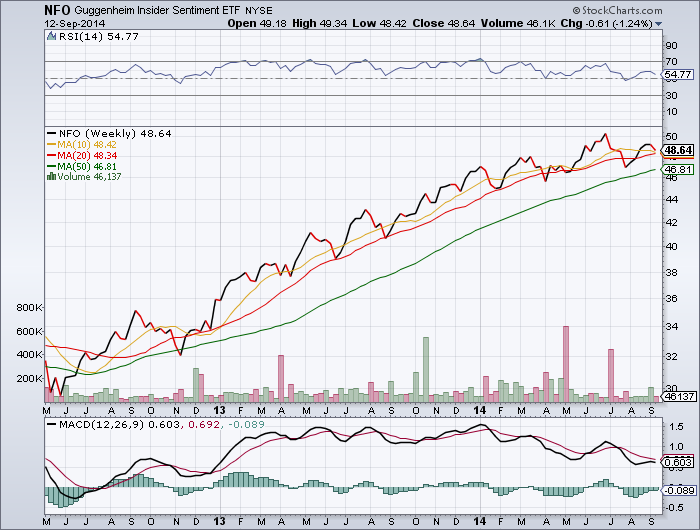
Even though the insider index [NFO] is a bit wobbly, for as long as the MA lines configuration of this index remains bullish [green line above the red] the insiders in this game will remain bullish on this market.
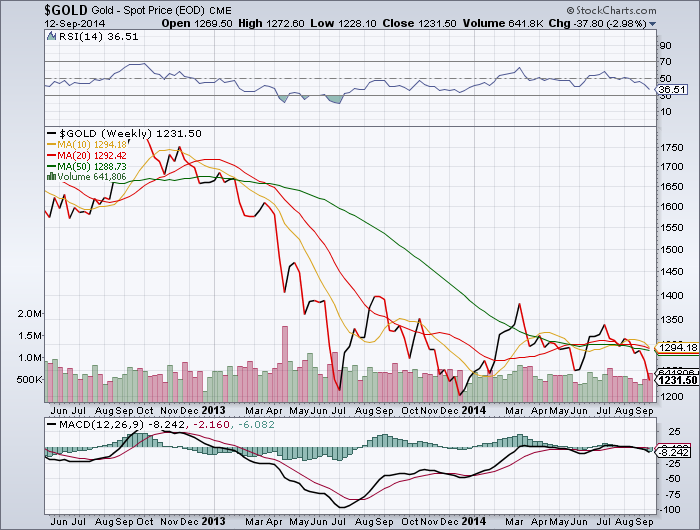
No change here as the yellow metal index [GOLD] remains dead in the water.
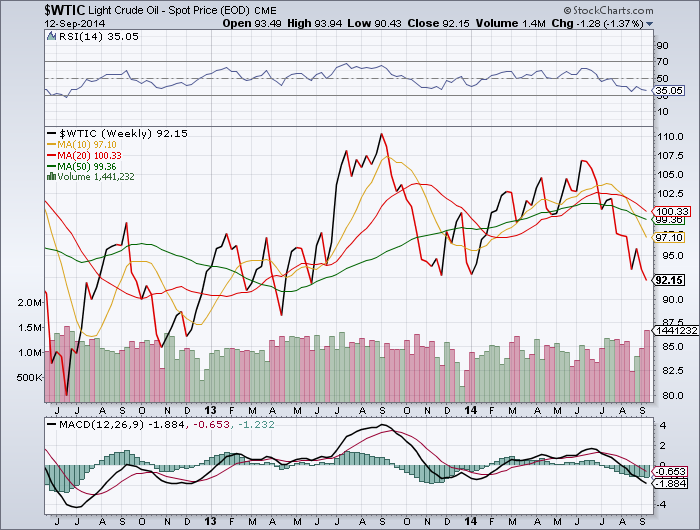
Even though the MA lines configuration for oil [WTIC] remains bullish [green line below the red] its MACD momentum index and RSI strength indicator continue to be stuck deep in their respective bearish territories. For as long as that is the case it will put the kibosh on any oil rally.
Ever since the middle of 2009 low interest rates, increasing earnings and an easy-money Fed have created a pretty good environment for this bull market. But with interest rates on the rise again and the Fed throttling its easy-money spigot, trading the markets "ain't gonna" be as easy as it used to be.
Here are some favored ETFs and ETF sectors in case the market comes your way:
Technology, Industrials, Financials, Biotech and Health-Care.
Leveraged Bull ETFs:
India 3x (INDL), Semis 3x (SOXL), NASDAQ 3x (TQQQ), Technology 3x (TECL), Healthcare 3x (CURE), China 3x (YINN), Technology 2x (ROM), NASDAQ 2x (QID), Biotech 2x (BIB), S&P 500, 3x (UPROW), Alerian 2x (MLPL), Financials 3x (FAS), Mid-Caps 3x (UMDD), S&P 500, 3x (SPXL), SOW 30, 3x (UDOW).
Non-Leveraged Long ETFs:
Biotech (FBT), India (INDY), Solar Energy (TAN), Biotech (BBH), Semis (SMH), Technology (QTEC), Pharma (PJP), Health-Care (RYH).
Leveraged Bear ETFs:
Inverse Silver 3x (DSLV), Oil 2x (SCO), Nat-Gas 2x (KOLD), Gold 2x (GLL), Russell 2000, (TWM), Oil&Gas 2x (DUG), DOW 30, 2x (DXD), Energy 3x (ERY), Small-Caps 3x (TZA), Financials 2x (SKF), S&P 500, 2x (SDS), Gold Miners 2x (DUST), Jr. Gold Miners 3x (JDSST).
Non-Leveraged Short ETFs:
Russell 2000 (RWM), EAFE (EFZ), DOW 30 (DOG), Mid-Caps (MYY), Emerging Markets (EUM), S&P 500 (SH), Active Bear (HDGE), NASDAQ (QQQ).
GOOD LUCK!