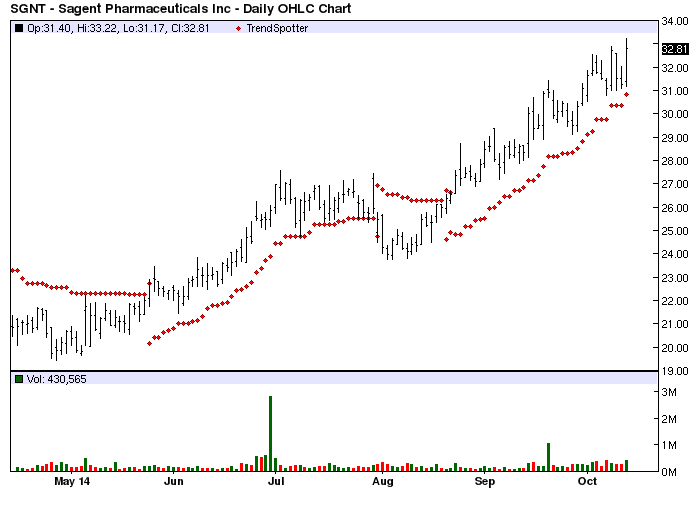
The Chart of the Day belongs to Sagent Pharmaceuticals (SGNT). I found the stock by sorting the very short All Time High list and then used the Flipchart feature to review the charts. Since the Trend Spotter signaled a buy on 8/30 the stock gained 24.47%.
Sagent Pharmaceuticals, Inc. is a pharmaceutical company that develops and sources products with primary focus on generic injectable pharmaceuticals. Products offered by the Company cover a range of anti-infective, oncolytic and critical care indications in a variety of presentations, including single- and multi-dose vials, pre-filled, ready-to-use syringes, medical devices and premix bags.
Barchart's Opinion trading systems are listed below. Please note that the Barchart Opinion indicators are updated live during the session every 10 minutes and can therefore change during the day as the market fluctuates. The indicator numbers shown below therefore may not match what you see live on the Barchart.com web site when you read this report.
Barchart technical indicators:
- 100% Barchart technical buy signals
- Trend Spotter buy signal
- Above its 20, 50 and 100 day moving averages
- 8 new highs and up 15.81% in the last month
- Relative Strength Index 64.93%
- Barchart computes a technical support level at 30.35
- Recently traded at 3281 with a 50 day moving average of 28.37
Fundamental factors:
- Market Cap $1.05 billion
- P/E 76.90
- Revenue expected to grow 17.60% this year and another 31.20% next year
- Earnings estimated to shrink 69.50% this year but increase again by 196.60% next year and continue to compound at an annual rate of 31.20% for the next 5 years
- Wall Street analysts issued 1 buy and 7 hold recommendations on the stock
Use the 50 and 100 day moving averages to gauge weakness and exit points.