The October 17 blog postulated tat the 260 point DOW rally on that Friday was nothing more but a market's dead-cat's bounce. Well, as dead cats go, this feline proved to be very much alive as it bounced from a four week losing streak to clawing back most losses from this sharp selloff. The large-cap SPX had its best weekly gain in two years as it turned out that stocks were oversold, investors were over-worried about global growth, over-worried about corporate earnings, over-worried about Ebola - and so the market pulled the plug and rallied.
Also, the market started to turn to the upside on October 16, when a Fed member suggested that they would consider delaying the end of QE which is expected this week. The main driver behind this five-year rally has been the Fed's QE wide-open easy money spigot. But if that is all there is to keep this rally going - watch out down below!
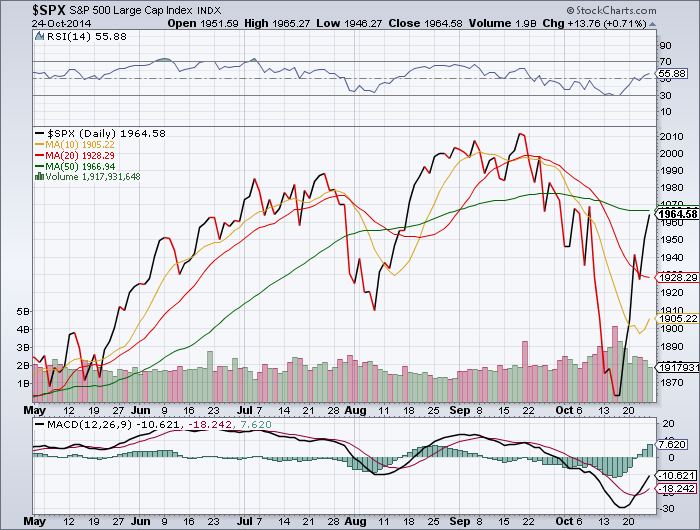
Check out this SPX large-cap index and note that the latest V-shaped snapback rally looks eerily similar to the snapback in early August. Also note what happens when the market does not get a chance to consolidate after a steep drop-off.
OK, the MACD momentum signal bars are back on top of the demarcation line, which is bullish for the market. That the RSI strength indicator is back in bullish territory also bodes well for the market. But note that the Moving-Average lines configuration remains extremely bearish with the green line above the red and the gap is widening despite the recent sharp rallies.
Only when this configuration turns bullish with the green line below the red, will there be an "all-clear" bullish signal for the market.
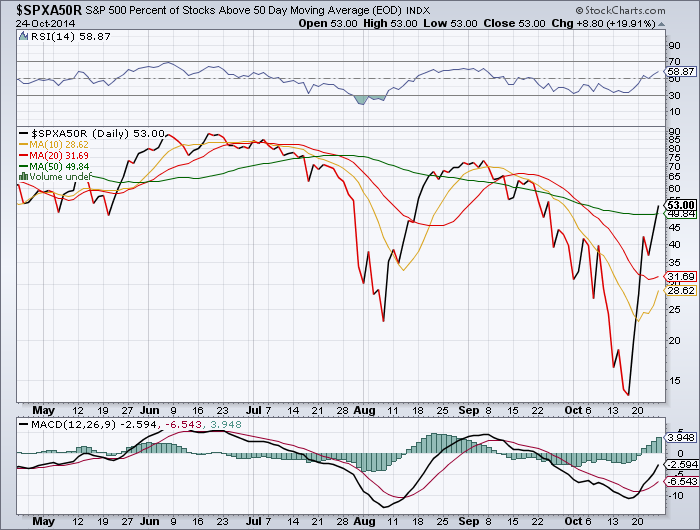
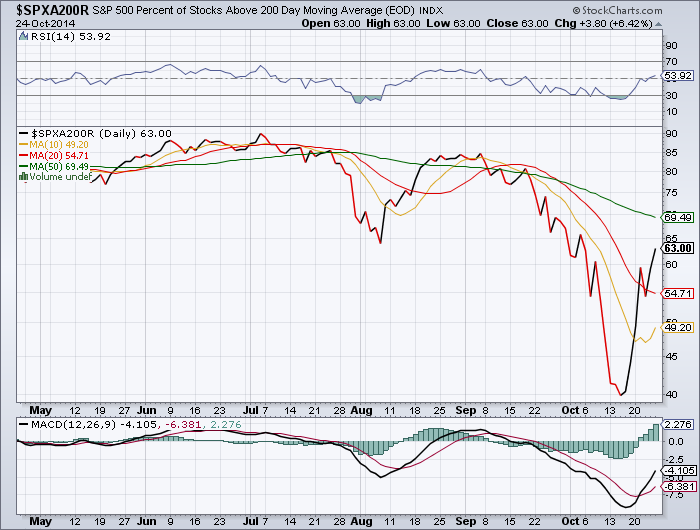
Note that the percent of stocks above their respective 50 and 200 day moving averages show the same configuration as the S&P 500 index, which emphasizes the warning signal for market participants by the previous chart.
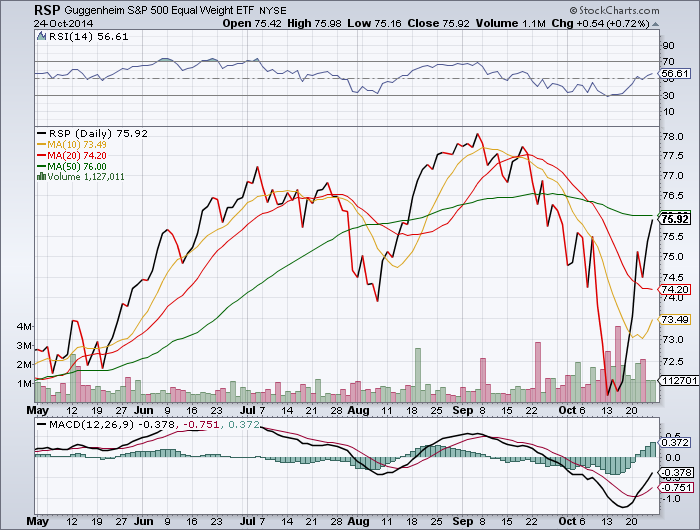
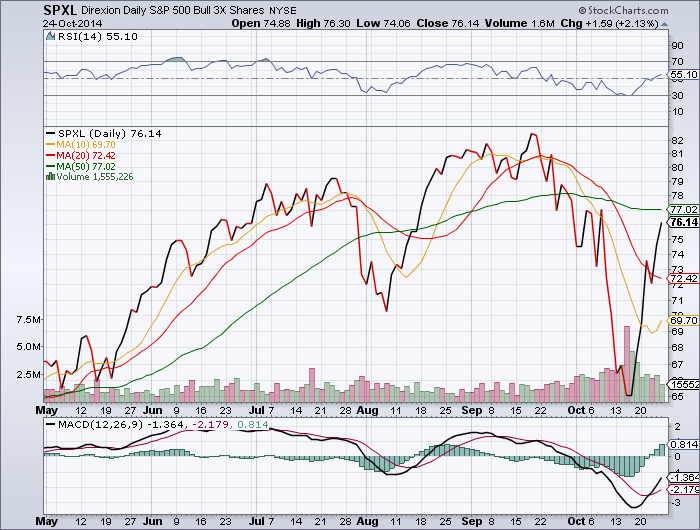
Note that the bull-components of this Troika [RSP] and [SPXL] show the results of their respective V-shaped snapback rallies. But while their MACD signal bars and RSI strength indicators are back in their respective bullish territories, the all-important moving average configurations remain extremely bearish as the gap between the red MA line below the green line widened.
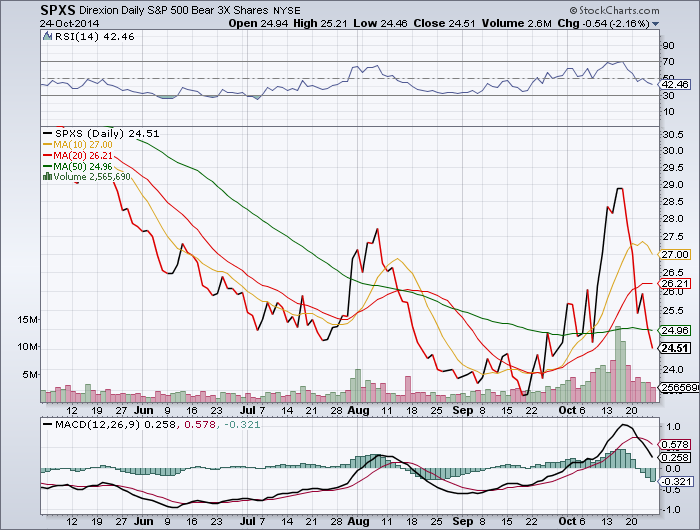
The bear index of this Troika [SPXS] shows a reverse V-shape decline and that certainly encourages the bulls in this game. But with the MACD momentum signal bars below the demarcation line and the RSI strength indicator in negative territory, the bear's retreat is suspect. That the MA lines configuration for the bear remains bullish [confusing?] with the green line below the red, is a sign that this retreat by the bear will short-lived.
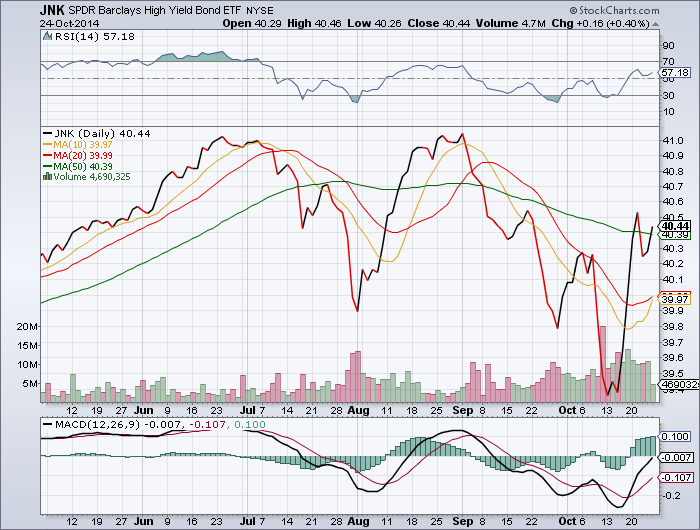
This market forecasting junk-bond canary is sending mixed messages. While this index is soaring along with the market, the MA lines configuration [green line above the red] remains extremely bearish. But with the MACD signal bars strongly above the demarcation line and with the RSI strength indicator in bullish territory, this little bird is siding with the bulls.
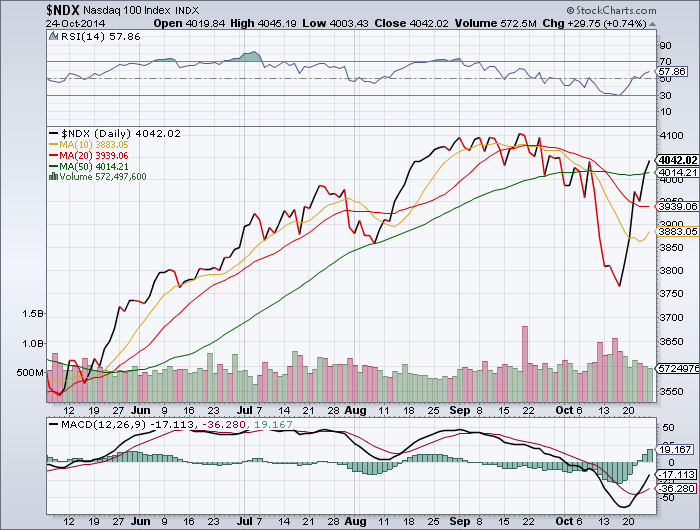
The NASDAQ 100 sends the same mixed messages as the other major indexes. A sharp V-shape rally for this index while its MA lines configuration [green line above the red] remains extremely bearish. Yet, its MACD momentum signal bars along with the RSI strength indicator are in their respective bullish territories, and that is a plus for the bulls.
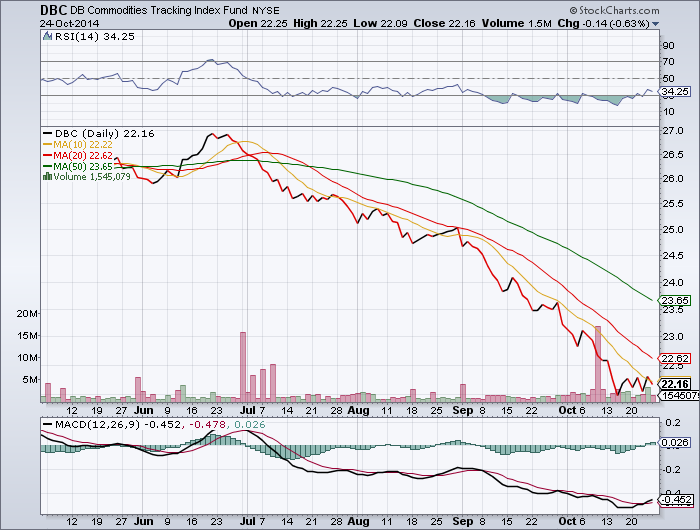
The commodity market [DBC] remains in a bearish mode while consolidating way down in a deep pit. Its MACD momentum index remains at the bottom of its bearish range and ditto for the RSI strength indicator. The MA lines configuration remains strongly bearish [green line above the red] all of which indicates that commodities generally remain in a bear market.
Gold wants to lift off the bottom but has a tough time doing so. Although its MACD momentum signal bars are on top of their demarcation line which is bullish for [GOLD] its MA lines configuration remains strongly bearish [green line above the red.] Its RSI strength indicator is sitting at dead neutral, which is a sign that gold could move sideways for awhile.

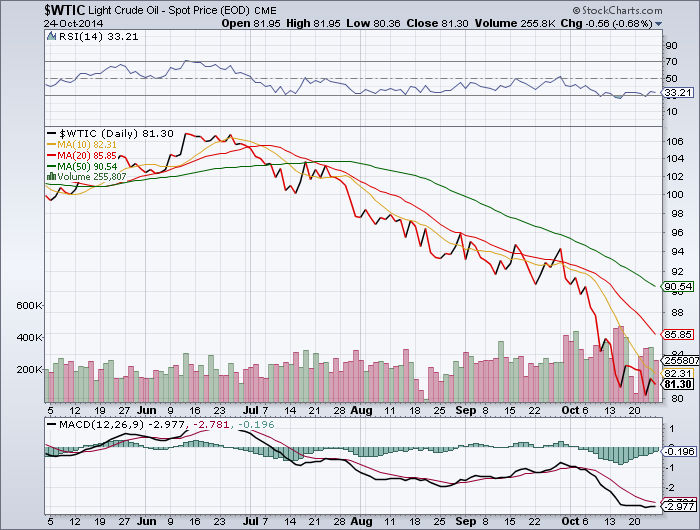
Oil [WTIC] continues to be a basket case with no indication that this could change anytime soon.
The S&P 500 index recovered most of its September/October nosedives, which suggests that last week's rallies could be more than just an oversold bounce.
So you might as well ride this bull when it rallies. Just make sure to keep your eyes on the monitor and one finger close to the sell-button. Just in case the market comes your way, here are some favoured ETFs to consider.
ETF sectors:
Transports (TRAN), Utilities (UTIL), NASDAQ 100 (NDX, Consumer Staples (XLP), Health Care (XLV), Technology (XLK).
Leveraged Bull ETFs: Semis 3x (SOXL), Health-Care 3x (CURE), Technology 3x (TECL), Biotech 2x (BIB), S&P 500, 3x (SPXL), NASDAQ 100, 3x (TQQQ), Mid-Caps 3x (MIDU), Small-Caps 3x (TNA), Alerian 2x (MLPL), Materials 2x (UYM), DOW 30, 3x (UDOW).
Non Leveraged Long ETFs:
India (INXX), Solar (TAN), Pharma (XPH), Semis (XSD), Biotech (FBE) Transports (XTN), Technology (QTEC), Discretionary (VCR), Small-Caps (VB)
Leveraged Bear ETF:
DOW 30, 2x (DXD), Financials 2x (SKF), Russell 2x (TWM), Emerging Markets 2x (EEV), Oil 2x (SCO), S&P 500, 2x(SDS), Financials 3x (TUV), NASDAQ 100, 2x (QID), Small-Caps 3x (TZA), Nat-Gas 2x (KOLD), Semis 3x (SOXS).
Non-Leveraged Short ETFs:
DOW 30 (DOG), Russell 2000, (RWM), EAFE (EFZ), Emerging Markets (EUM), S&P 500 (SH), Active Bear (HDGE), NASDAQ 100 (PAQ), Mid-Caps (MYY), Oil&Gas (DDG).
GOOD LUCK!