I usually avoid commenting in my instablog on the jobs report - except to say it does not matter in the scheme of things. Jobs are a lagging indicator, and my focus is to look for clues on where the economy is headed.
The headlines based on seasonally adjusted data was not excellent - however, the unadjusted data was outstanding. In the case of the BLS jobs report - I trust the un-manipulated unadjusted data significantly more than the seasonally adjusted data. The proof is the smooth blue bars created in the graph below.
Unadjusted Non-Farm Private Employment - Year-over-Year Change (blue bars) and Year-over-Year Growth Acceleration / Deceleration (red line)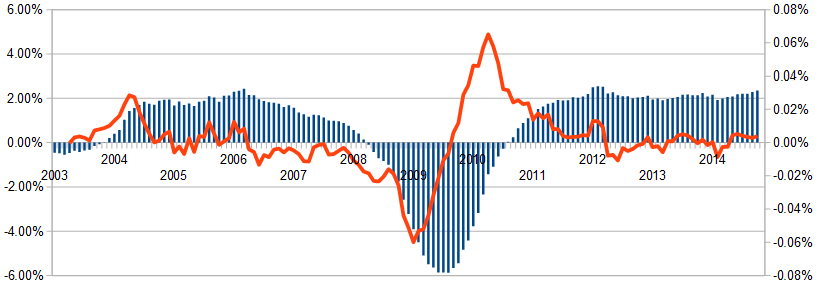
/images/z bls2.png
- The unadjusted jobs added month-over-month was the strongest October in the 21st century (year-over-year comparisons) - and historically the largest employment increase between September and October since this data series began in 1939.
- economic intuitive sectors of employment were strong.
- This month's report internals (comparing household to establishment data sets) were relatively inconsistent with the household survey showing seasonally adjusted employment improvement of 683,000 vs the headline establishment number of 214,000.
- The National Federation of Independent Business (NFIB) statement on the Jobs report is below.
A summary of the employment situation:
- BLS reported: 214K (non-farm) and 209K (non-farm private). Unemployment marginally fell from 5.9% to 5.8%.
- ADP reported: 230K (non-farm private)
- In Econintersect's October 2014 economic forecast released in late September, we estimated non-farm payroll growth at 170,000 (unadjusted based on economic potential) and 230,000 (fudged based on current overrun of economic potential).
- The market expected:
| Seasonally Adjusted Data | Consensus Range | Consensus | Actual |
| Nonfarm Payrolls - M/M change | 200,000 to 282,000 | 240,000 | 214,000 |
| Unemployment Rate - Level | 5.8 % to 6.0 % | 5.9 % | 5.8 % |
| Average Hourly Earnings - M/M change | 0.2 % to 0.3 % | 0.2 % | 0.1 % |
| Av Workweek - All Employees | 34.5 hrs to 34.6 hrs | 34.6 hrs | 34.6 hrs |
| Private Payrolls - M/M change | 205,000 to 277,000 | 235,000 | 209,000 |
The BLS reports seasonally adjusted data - manipulated with multiple seasonal adjustment factors, and Econintersect believes the unadjusted data gives a clearer picture of the jobs situation.
Non-seasonally adjusted non-farm payrolls rose 567,000 - the largest increase in the 21st century.
Historical Unadjusted Private Non-Farm Jobs Growth Between Septembers and Octobers (Table B-1, data in thousands) - unadjusted (blue line) vs seasonally adjusted (red line)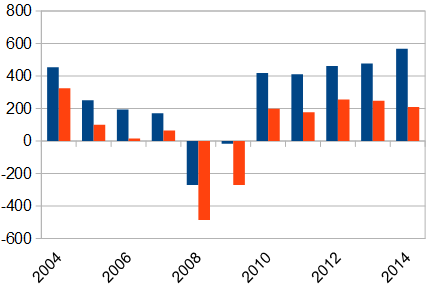
/images/bls non-adjusted change.PNG
Last month's seasonally adjusted employment was revised up.
Change in Seasonally Adjusted Non-Farm Payrolls Between Originally Reported (blue bars) and Current Estimates (red bars)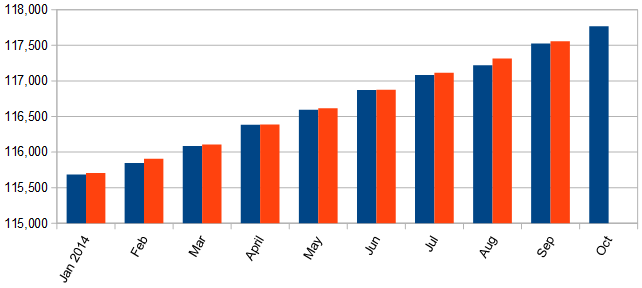 /images/z bls1.png
Most of the analysis below uses unadjusted data, and presents an alternative view to the headline data.
UnemploymentThe BLS reported U-3 (headline) unemployment improved from 5.9% to 5.8% with the U-6 "all in" unemployment rate (including those working part time who want a full time job) improved 0.3% to 11.5%. These numbers are volatile as they are created from the household survey.
BLS U-3 Headline Unemployment (red line, left axis), U-6 All In Unemployment (blue line, left axis), and Median Duration of Unemployment (green line, right axis)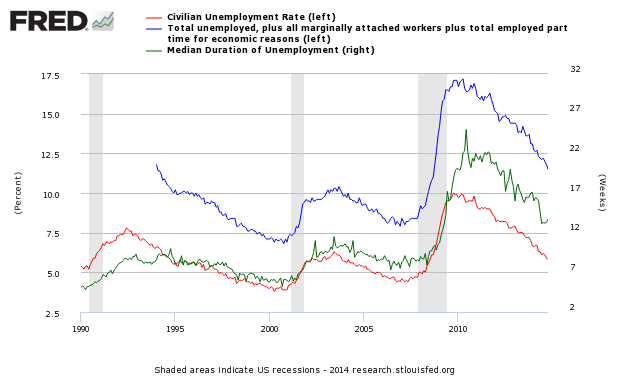
Econintersect has an interpretation of employment supply slack using the BLS unadjusted data base, demonstrated by the graph below. The employment-population ratio improved 0.2 to 59.2.
Employment-Population Ratio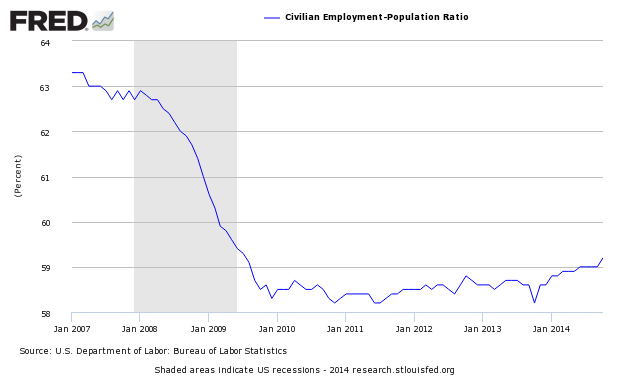
The jobs picture when you view the population as a whole. This ratio is determined by household survey.
- Econintersect uses employment-populations ratios to monitor the jobless situation. The headline unemployment number requires the BLS to guess at the size of the workforce, then guess again who is employed or not employed. In employment - population ratios, the population is a given and the guess is who is employed.
- In this latest BLS report employment-population ratio was improved from 59.0 to 59.2 - this ratio remains above its short term trend between 58.5 and 58.6. The employment-population ratio tells you the percent of the population with a job. Each 0.1% increment represents approximately 300,000 jobs. [Note: these are seasonally adjusted numbers - and we are relying on the BLS to get this seasonal adjustment factor correct]. An unchanged ratio would be telling you that jobs growth was around 150,000 - as this is approximately the new entries to the labor market caused by population growth.
The 3 month rolling average growth trend in the establishment survey's non-farm payroll improved, but the longer term trends are mixed depending on the periods selected - however, it seems the trend in 2014 has been on an uptrend.
Unadjusted Non-Farm Payrolls Year-over-Year Growth
Another way to view employment is to watch the total hours worked which has been within a narrow range for the last 4 years with a few bumps.
Percent Change Year-over-Year Non-Farm Private Weekly Hours Worked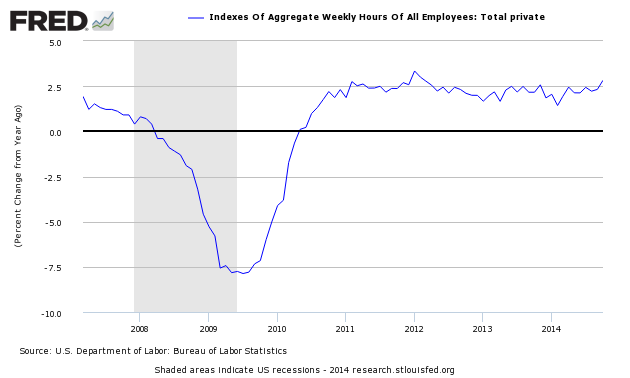
The bullets below use seasonally adjusted data from the establishment survey except where indicated:
- Average hours worked (table B-2) improved 0.1 to 34.6. A rising number normally indicates an expanding economy .
- Government employment was up 5K (5,000) with the Federal Government down 3K, state governments up 1K and local governments up 7K.
- The big contributor to employment growth this month was food services (41.8K) - but generally every sector had moderate to good growth.
- The headwinds to employment this month was the information sector (-4k)
- Manufacturing was up 15K, while construction was up 12K.
- The unemployment rate (from household survey) for people between 20 and 24 (Table A-10) degraded from 11.4% to 10.5% - a reversal of last month. This number is produced by survey and is very volatile.
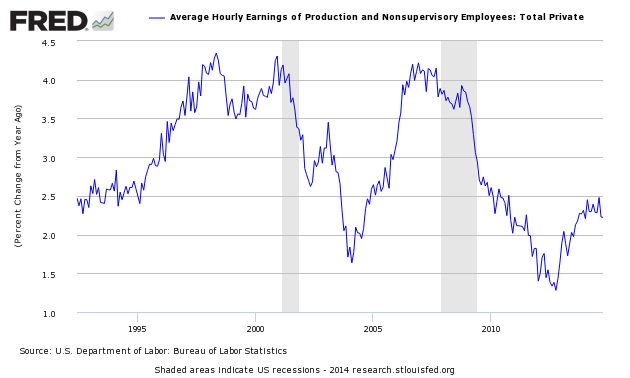
- Average hourly earnings (Table B-3) was up $0.03 to $24.57.
Economic markers used to benchmark economic growth (all from the establishment survey) were positive and well away from recessionary levels.
The truck employment was up 3.9K. Still year-over-year improvement is well into expansion territory, although it has a declining long term growth trend line and an improving short term trend.
Truck Transport Employment - Year-over-Year Change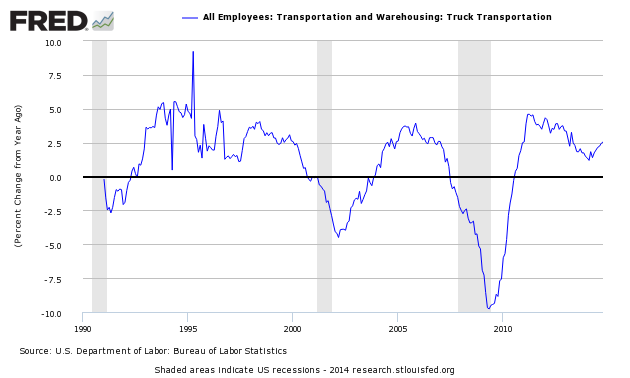
Temporary help increased (15.1K). Note that many believe, that Obamacare is creating a shift from permanent to temporary jobs. If this is the case, this metric would be inoperative.
Temporary Help Employment - Year-over-Year Change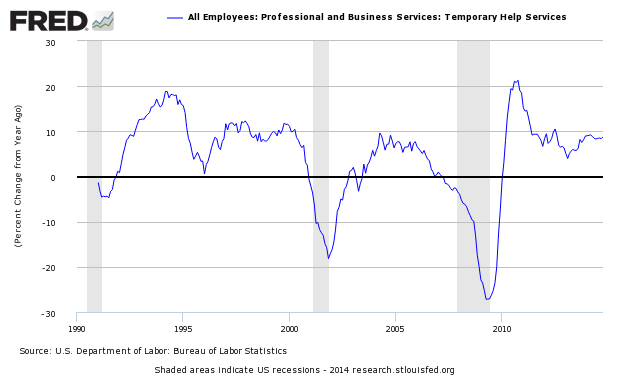
Econintersect believes the transport sector is a forward indicator. Others look at temporary help as a forward indicator........
You can read my entire review of the BLS jobs report [here].
Other Economic News this Week:The Econintersect Economic Index for November 2014 is showing our index on the low side of a tight growth range for almost a year. Although there are no warning flags in the data which is used to compile our forecast, there also is no signs that the rate of economic growth will improve. Additionally there are no warning signs in other leading indices that the economy is stalling - EXCEPT ECRI's Weekly Leading Index at the zero growth line.
The ECRI WLI growth index value crossed slightly into negative territory which implies the economy will not have grown six months from today.
Current ECRI WLI Growth Index
The market was expecting the weekly initial unemployment claims at 280,000 to 290,000 (consensus 283,000) vs the 278,000 reported. The more important (because of the volatility in the weekly reported claims and seasonality errors in adjusting the data) 4 week moving average moved from 281,250 (reported last week as 281,000) to 279,000.
Weekly Initial Unemployment Claims - 4 Week Average - Seasonally Adjusted - 2011 (red line), 2012 (green line), 2013 (blue line), 2014 (orange line)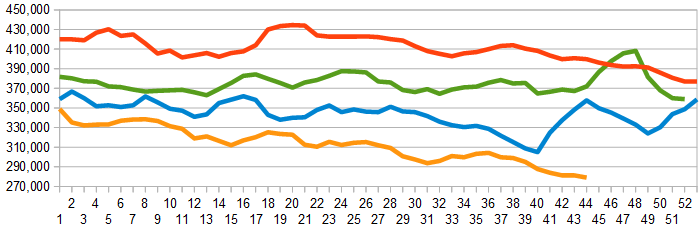
Bankruptcies this Week: Privately-held Marion Energy, UniTek Global Services
You can view all of our analysis this past week [here].