Trading: Keep it Simple
"Life is really simple, but we insist on making it complicated." Confucius
The past year definitely favored traders who followed the golden rule of trend trading: "let your profits run". And I see no reason this will change in 2015.
This past year also once again proved that the most important aspect of trading is knowing which tactic is suitable for the trading environment you are in right now. This determination is based on the pattern on the chart which is a reflection of the underlying fundamentals. If the chart is showing a pattern of higher lows and higher highs, this is a reflection of a fundamentally bullish environment and buying dips is the tactic that provides the path of least resistance to profits. Likewise if the pattern is one of lower highs and lower lows, then this is a fundamentally bearish environment and the path to profits will be selling rallies. The challenge of this, as Confucius pointed out, is keeping it that simple. If you want to help yourself, it is a question of how successful do you want to be?
The graph in Figure 1, demonstrates the harmony and rhythm that such a simple approach can deliver.
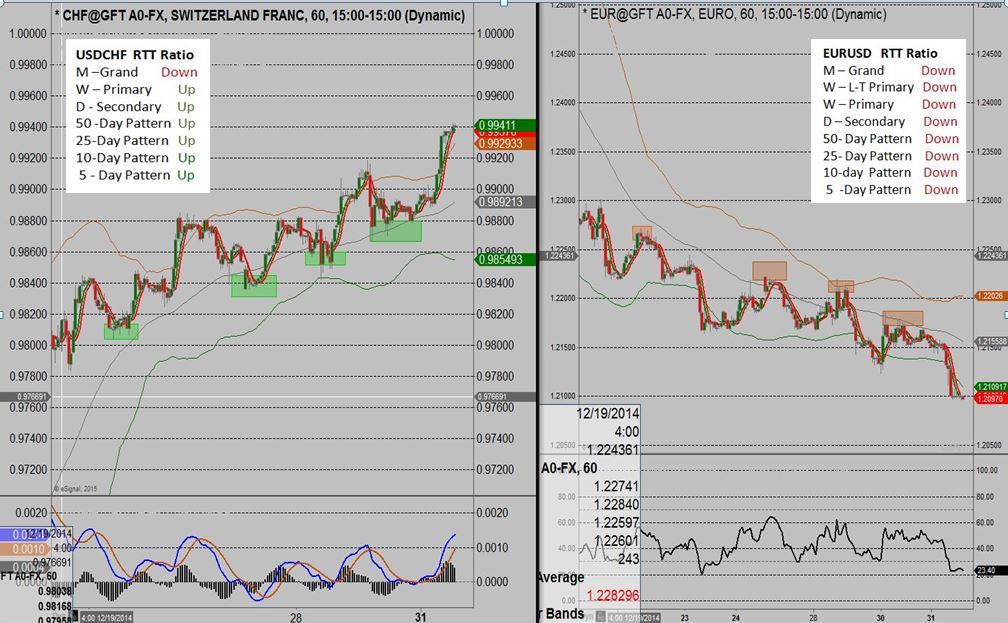 Figure 1. 60-minute charts of the Dollar/Swiss and the Euro/Dollar in late December 2014
On the left side is USDCHF and on the right side EURUSD. The colored boxes represent low risk price levels to initiate trades in-line with the dominant trends. i.e.: buying dips in an uptrend for the Swissy, and selling rallies in a downtrend for the Euro. Those colored boxes also represent identical retracement ratios of previous impulse moves. This tendency of predictable behavior demonstrated by the regularity of market retracements typifies what Warren Buffett meant when he summarized the Berkshire Hathaway investment philosophy: "Our approach is very much profiting from lack of change rather than from change".
If something is already working, why would we look for the opposite to happen? If the definition of insanity is doing the same thing over and over again expecting different results, then enlightenment must mean simply doing the same thing over and over again and getting positive results. This outlook in trading or investing becomes particularly clear when we reach the conclusion that the pattern on the chart is a definitive reflection of the underlying fundamentals of that market. With that understanding comes the realization that it is the "effect" of price movement - the pattern on the chart -- which provides a simpler path to wealth accumulation, than otherwise trying to extrapolate, or worse predict, the "cause" or price movement.
While it might be tempting to watch news about the markets, and hear commentators talk about causation -- why the market did what it did that day or that month, or the year before - by trying to connect the dots of the daily news with what price actually did that day, we are complicating the process instead of simplifying it. Statistically it's more likely that the market will continue to do what it is doing now, rather than reverse itself. Therefore it is always better to trade with the current pattern with the assurance that should that pattern reverse, we can then trade in that new direction.
While the charts in Figure 1 give us a great look at market behavior on a shorter-term basis, what about the long view? The chart in Figure 2 is a monthly chart of the EURUSD. The purple line marks the 50% retracement level from the 2000 low to the 2008 high. This market ended 2014 at an 8-year low settlement to close below that 50% level for the first time, and this past week posted a lower low to the 2012 low to complement the current 8-year pattern of lower highs. (Many technical studies place emphasis on the 50% retracement level with a close below making lower prices more likely.)
 Figure 2. Monthly chart of EURUSD
With the historic long-term pattern in Figure 2 aligned with the shorter-term patterns on the lower time frames, and all the patterns reflecting underlying bearish fundamentals we see no change from the 2014 trading environment to the 2015 environment.
Jay Norris is the author of two McGraw-Hill books on trading and teaches the art of trading in live markets at Trading University. To see his weekly forecasts on YouTube going back over 2 years go to: Weekly Forex Forecast.