A brief discussion of why I am maintaining this blog occurs in "AXPW Fails-To-Deliver Charts 2/11/2013" along with charts that maintain the pre-split adjustment volumes and prices through the end of 2014.
As before, I will update the charts here approximately every two weeks as data from the SEC becomes belatedly available. It is not timely or useful for assessing current behavior at all.
As before, keep in mind that volume of fails are aggregate volumes at a point in time, not daily volume changes. This means you can not see the addition of new failures or the closing of prior failures in discrete terms, except at the beginning and end of a period in which some appear and finally disappear.
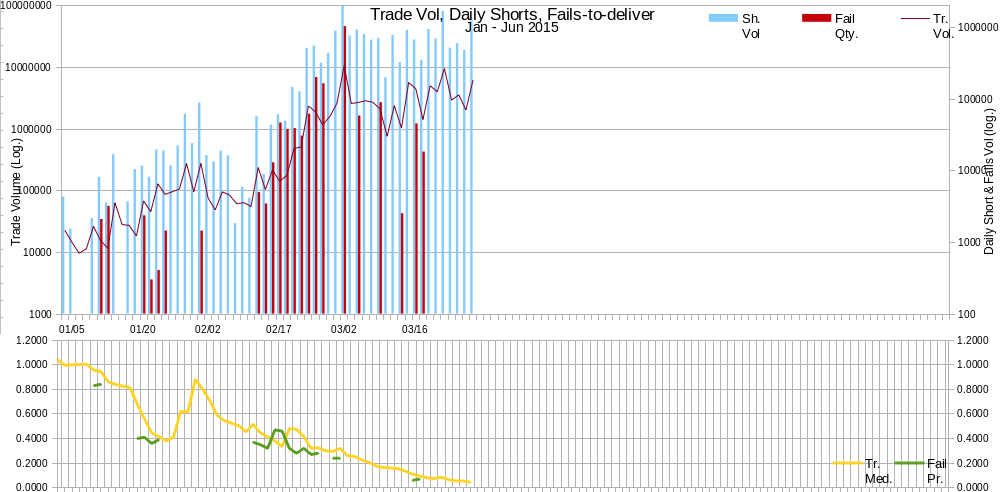
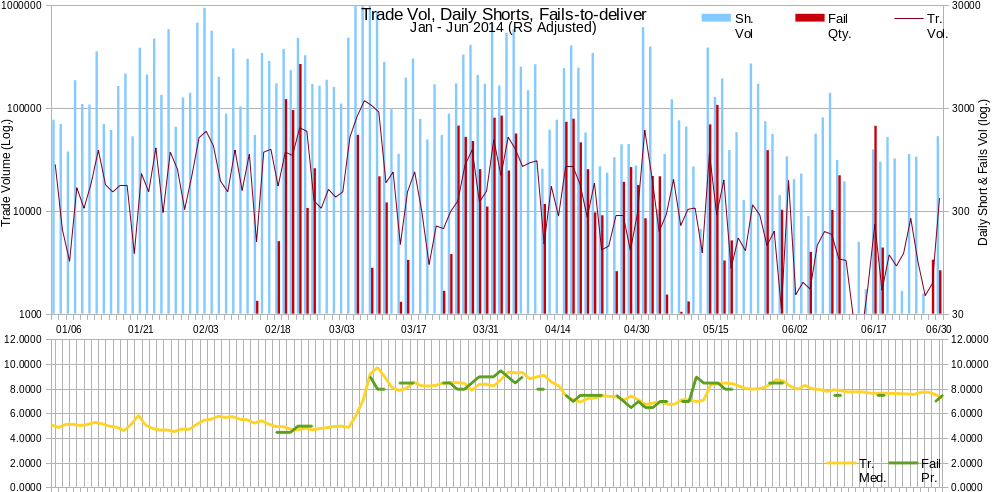
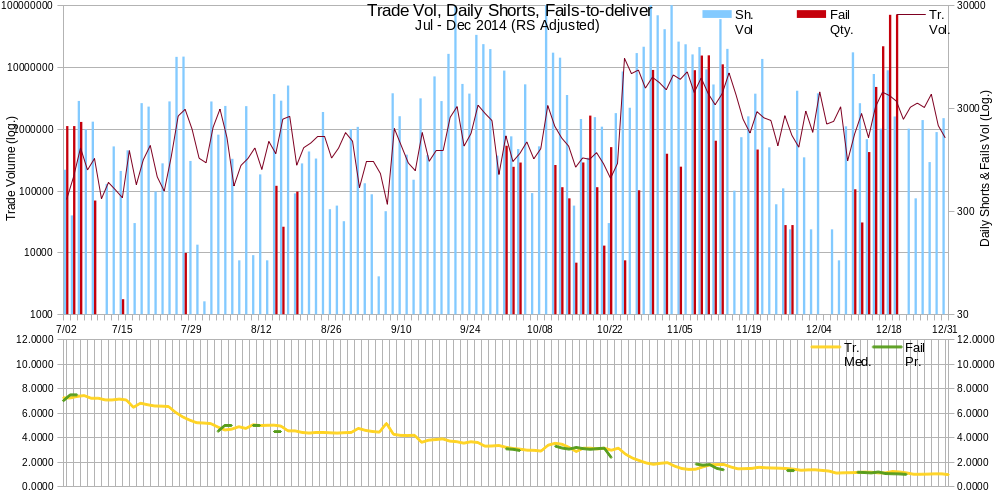
The following charts are reverse-split adjusted. Note that the volume charts are logarithmic, so movements are visually "magnified" at the lower ranges and "reduced" in the upper ranges.
The following charts are in the "natural" units now - no split adjustment was needed. Note how the shorts and fails jumped big just before the supposed 2/23/2015 "cashless conversion" period was set to begin. If these "early" failures were part of a coordinated effort to assure a "cashless conversion" or a response to the knowledge that one was certain to occur, it can't be determined from this data. Regardless, it does show the predatory nature of those involved in the latest financing round.