In this note, we focus on credit default swap trading volume in 1,056 non-bank corporate reference names for the 259 weeks from the week ending July 16, 2010 through the week ending June 26, 2015. The highest non-dealer trading volumes are found on "story credits" like J. C. Penney (JCP), Caesars Entertainment Operating Company, Inc. (CZR), Eastman Kodak Company (KODK), Arcelormittal (MT), and RadioShack Corporation (RSH) (RSHCQ).
Conclusions: We find that only 13 corporates averaged six or more non-dealer trades per day over the 259 week period studied. We conclude that corporate credit default swaps are potentially subject to manipulation and collusion, as recent lawsuits allege. For analytical reasons as well, we believe that default probability models which use CDS quotes, un-weighted by trading volume, are problematic. The most serious problem is that users of such models are at risk of manipulation by dealers who understand the model's construction.
The Analysis of Non-Bank Corporate Credit Default Swap Trading Volume
In this note, we analyze credit default swap trading volume for the 1,056 non-bank corporate reference names among the 1,256 reference names for which CDS trades were reported by the Depository Trust & Clearing Corporation during the 259 week period ending June 26, 2015. The weekly trade information is from the Section IV reports from DTCC. The data is described this way in the DTCC document "Explanation of Trade Information Warehouse Data" (May, 2011):
"Section IV (Weekly Transaction Activity) provides weekly activity where market participants were engaging in market risk transfer activity. The transaction types include new trades between two parties, a termination of an existing transaction, or the assignment of an existing transaction to a third party. Section IV excludes transactions which did not result in a change in the market risk position of the market participants, and are not market activity. For example, central counterparty clearing, and portfolio compression both terminate existing transactions and re-book new transactions or amend existing transactions. These transactions still maintain the same risk profile and consequently are not included as 'market risk transfer activity.'"
We again confirm that our emphasis is not on gross trading volume. As of January 10, 2014, dealer-dealer trading volume made up 59.32% of all single name credit default swaps that were live in the DTCC trade warehouse at that point in time. It would be nearly costless for dealers to inflate gross trading volume by trading among themselves. Instead, we focus on "end user" trading where at least one of the parties to a trade is not a dealer, as defined by the DTCC. Accordingly, we make the following adjustments to the weekly number of trades reported by DTCC for each non-bank corporate reference name:
- We divide each weekly number of trades by 5 to convert weekly trading volume to an average daily volume for that week.
- From that gross daily average number of trades, we classify 59.32% of trades as "dealer-dealer" trades, using the average "dealer-dealer" share of trades in the DTCC trade warehouse as of January 10, 2014.
- The remaining 40.68% is classified as daily average "non-dealer" volume, the focus of the reporting below.
Important note: the trading averages for each reference name are reported only for those weeks in which there were trades. In other words, the averages are conditional on trades taking place.
Daily Non-Dealer Trading Volume in Non-Bank Corporate Reference Names
Of the 1,256 reference names for which DTCC reported credit default swap trades in the 259 week period ending June 26, 2015, 1,056 were non-bank corporations. We first analyze the 259 week averages for the 1,056 non-bank corporations. The daily average non-dealer trading volume, calculated as described above, was distributed as follows:
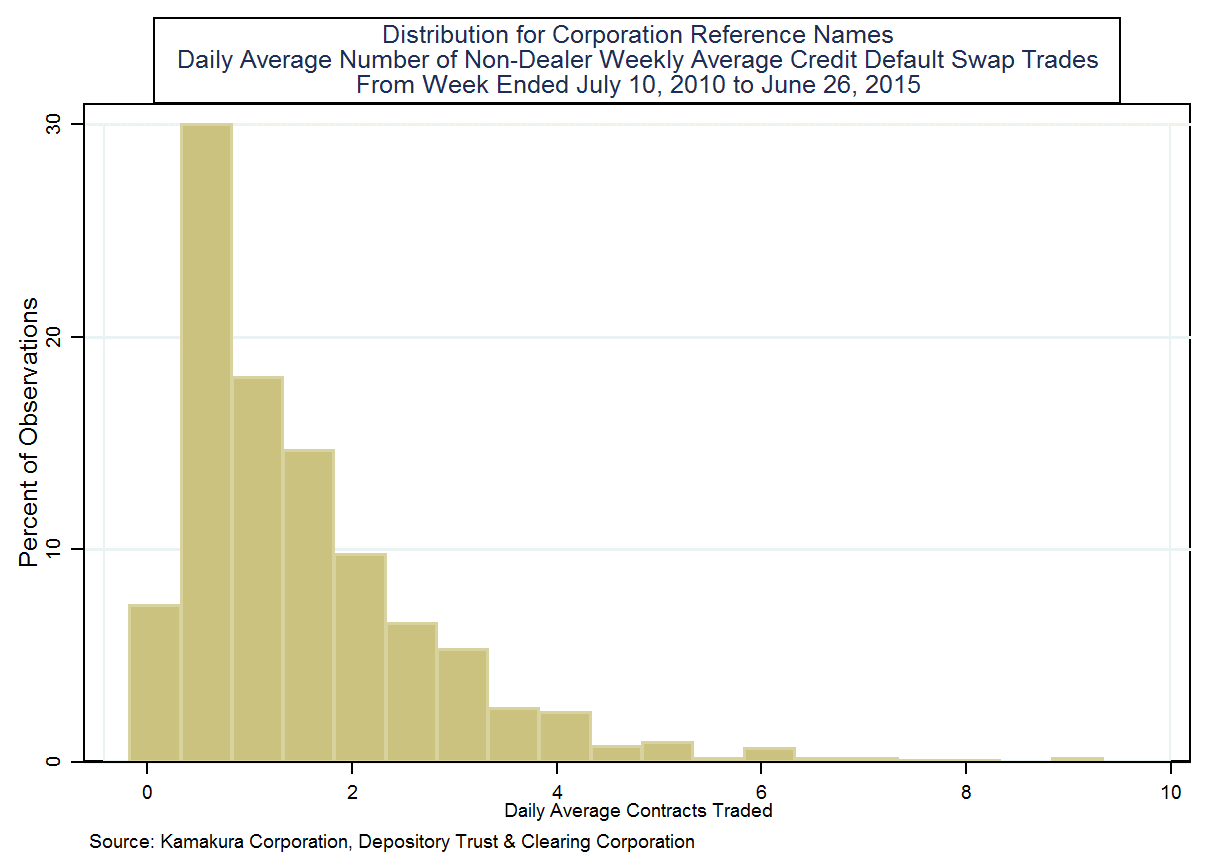
The conclusions that can be drawn from this table are summarized here:
- 75% of the non-bank corporations had trading volume that averaged less than 2.1 non-dealer CDS contract per day over the 259 weeks ending June 26, 2015.
- 95% of the non-bank corporations had trading volume that averaged less than 3.9 non-dealer CDS contracts per day over the 259 weeks ending June 26, 2015.
- 99% of the non-bank corporation had trading volume that averaged less than 6.2 non-dealer CDS contracts per day over the 259 weeks ending June 26, 2015.
- Only two of the 1,056 non-bank corporations, J. C. Penney and Caesars Entertainment Operating Company, had trading volume that averaged more than 9 non-dealer trades per day in the 259 weeks ended June 26, 2015.
- The average number of non-dealer trades per day over the period studied was 1.5 trades.
- The median number of non-dealer trades per day over the period studied was 1.1 trades.
We conclude that, like the 1,256 reference names overall, trading volume for the 1,056 non-bank corporations with CDS traded during the 259 weeks ending June 26, 2015 is minimal when analyzed on a non-dealer daily average basis.
Analyzing Trading Volume in Aggregate
We now analyze all 259 weeks of data, not just the average over that period, for all 1,056 non-bank corporations for which DTCC reported non-zero trade volume. There were 273,504 = 1,056 x 259 potential observations on CDS trading volume for these non-bank corporations, and there were no trades for 92,769 observations, 33.9% of the total potential observations. The distribution of non-dealer trades per day over the 180,735 non-zero observations is summarized in the following chart:
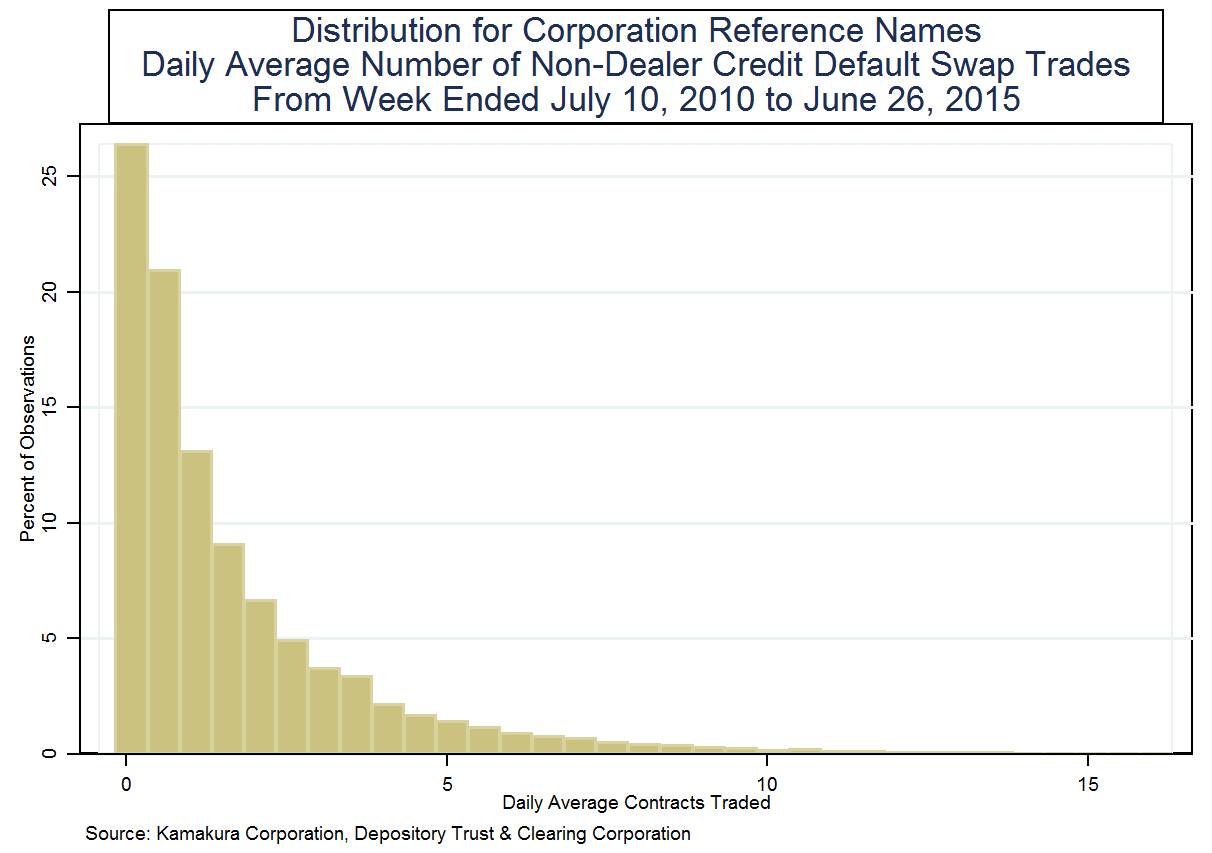
One can draw the following conclusions over the 180,735 non-zero weekly observations:
- 75% of the observations showed 2.3 non-dealer trade per day or less.
- 95% of the observations showed 6.2 non-dealer trades per day or less.
- 99% of the observations showed 11.1 non-dealer trades per day or less.
- The median number of non-dealer trades per day was 1.0 and the average number of non-dealer trades per day was 1.8.
- Out of 180,735 non-zero observations, there were only 232 observations with more than 20 non-dealer trades per day. There were only 46 observations with more than 30 non-dealer trades per day, and only 16 observations with more than 40 non-dealer trades per day.
As we stated above, this confirms that there is minimal trading volume in the 1,056 non-bank corporations on which CDS trades were reported by DTCC in the 259 weeks ended June 26, 2015. The 25 non-bank corporates with the highest daily average non-dealer trading volume, conditional on trades occurring, over the full 259 week period are listed here:

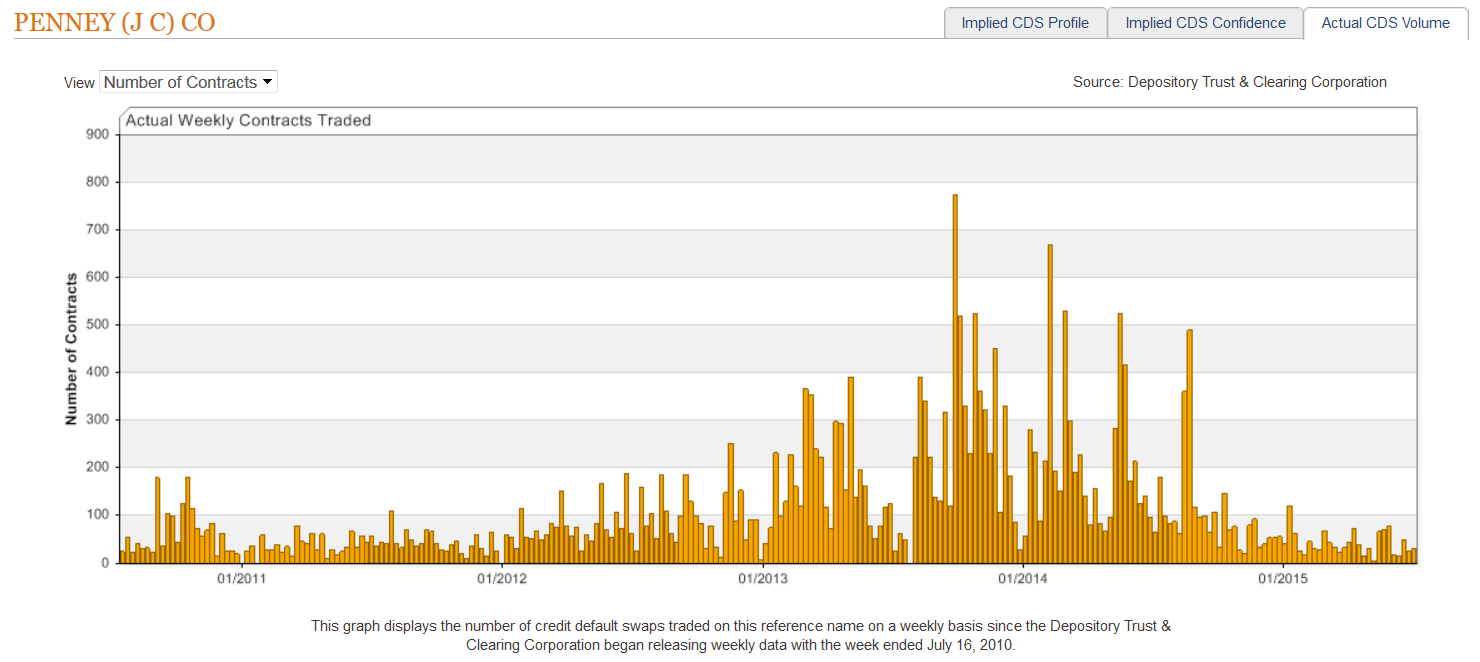
Weekly gross trading volume by number of contracts for J.C. Penney Company, Inc. is shown below:
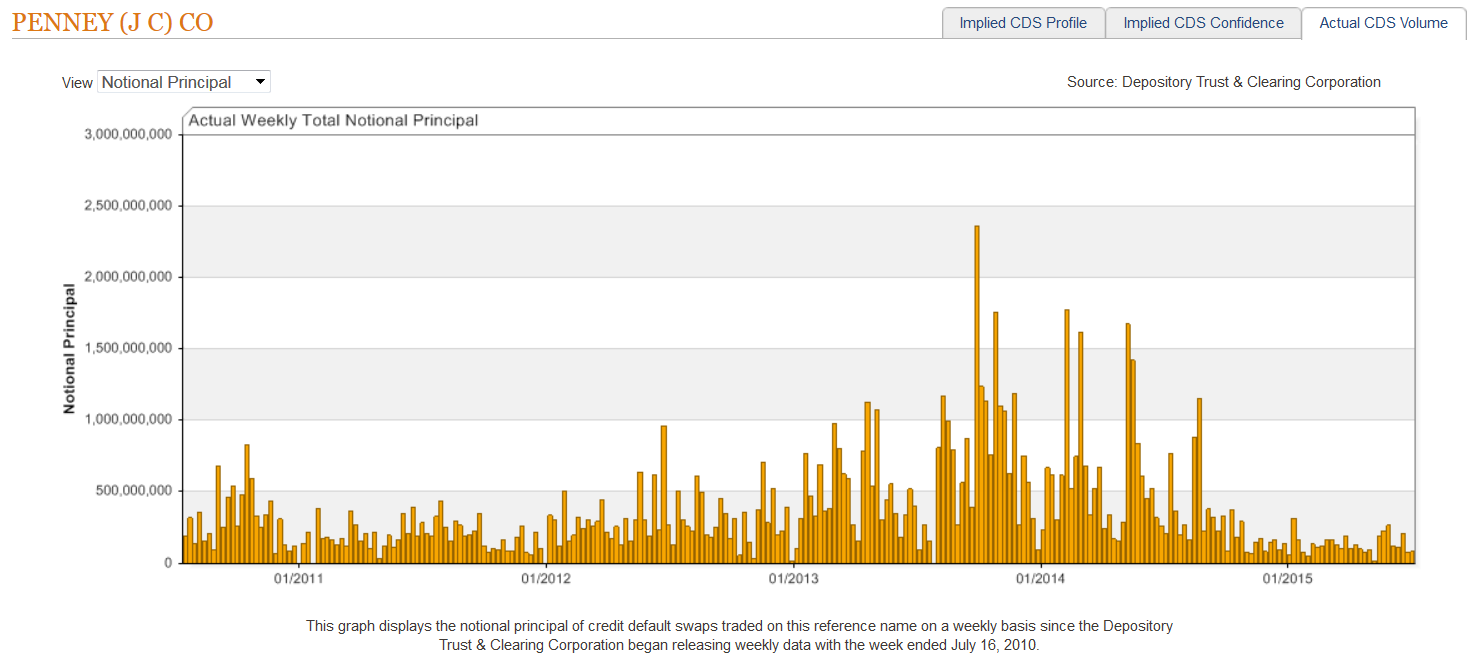
Weekly gross trading volume by notional principal for J.C. Penney Company, Inc. is shown here:
Conclusions
Our conclusions regarding credit default swaps and non-bank corporations are the same as the conclusions for municipalities, U.S. banks, and international banks. Credit default swaps do not provide a practical basis for broad-based default probability analysis for a number of reasons:
- The use of credit default swaps is analytically incorrect as a method of determining the probability of default for any reference name, as pointed out by Robert Jarrow in the Journal of Fixed Income.
- The number of defaulters on which credit default swaps were actively traded (prior to default) in the corporate market is relatively small and statistical significance is a problem, even if the analytical concerns cited by Prof. Jarrow could be circumvented.
- There is a risk of collusion that is similar to the risks of collusion in the Libor market, and lawsuits alleging such collusion have been filed by institutional investors in both the United States and in Europe. If dealers understood the workings of a default model using credit default swap "quotes" as input, they are free to manipulate the credit risk perceptions of the model user. The model builder/vendor in this case would be nothing but a facilitating tool of Wall Street.
- Credit default swap pricing is affected by the probability of a bail-out of senior debt holders, both for banks and for corporates, so CDS pricing on senior debt understates the true risk of failure for an organization that is "too big to fail."
Donald R. van Deventer
Kamakura Corporation
Honolulu, July 8, 2015