I am skipping the REIT Basket update since there has been no activity.
+++++++++
I last updated the CEF basket strategy here: Update On CEF Basket Strategy As Of 10/6/15 - South Gent | Seeking Alpha
I have a lengthy discussion of bond CEF risks in the Appendix section to an earlier post:Update For Closed End Fund Basket Strategy As Of 8/14/15 - South Gent | Seeking Alpha(scroll to "General Risk Discussion for Leveraged Bond CEFs") I also discussed those risks here. I will not be repeating those discussions.
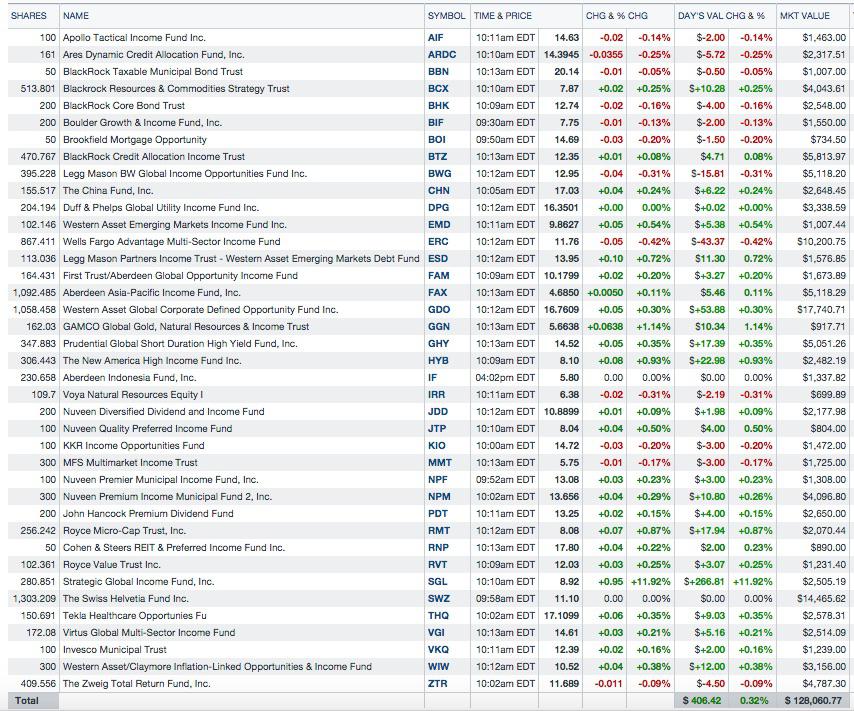
I view the closed end portfolio to be a balanced worldwide portfolio within a larger portfolio that includes individual stock and bond selections.
I place an emphasis on income generation and own a number of CEFs that pay monthly dividends.
I will change the weightings in the CEF portfolio based on my opinions about the balance between risks and rewards.
I have tilted this portfolio some toward bonds this year, having sold a number of stock ETFs as chronicled in prior updates. It remains to be seen whether this shift will work. It may work simply by going down less on a total return basis than the far more heavily weighted stock CEF allocation from 2013-2014.
There are several reasons for reducing the stock CEF allocation and increasing the bond CEF allocation. I have been discussing those reasons in my Portfolio Positioning and Management Updates.
For the time being, I am not making open market purchases of leveraged EM and junk bond CEFs. I am averaging down through dividend reinvestment.
For the remainder of this year, I will not make an open market purchase of a leveraged bond CEF that has less than 50% in investment grade bonds.
It is possible that junk bonds have hit a stabilization point, but I will need more evidence that the worst is over: JNK Interactive Stock Chart
A scenario where periods of deflation alternate with periods of low inflation would be anathema to most junk bond issuers, particularly those who in sectors experiencing the more profound deflationary pressures. Currently, deflationary pressures are most profound in the commodity sectors.
Commodity index funds have seen better days:
iShares S&P GSCI Commodity-Indexed Trust (GSG) Interactive Chart iPath Bloomberg Commodity Index Total Return ETN (DJP) Interactive Chart iPath GSCI Total Return Index ETN (GSP) Interactive Stock Chart ELEMENTS ETN-Rogers Trust (RJI) Interactive Stock ChartTable as of 10/14/15 (Snapshot During Trading Day):
I unintentionally omitted NPI and FPF from this table: Update For Closed End Fund Basket Strategy As Of 8/14/15 - South Gent | Seeking Alpha ( "5. Bought 100 NPI at $13.27"); Update For Closed End Fund Basket Strategy As Of 8/14/15 - South Gent | Seeking Alpha ("4. Bought Back FPF at $21.72-Satellite Taxable")
Several of these CEFs went ex dividend yesterday for their monthly distributions including the following:
BlackRock Core Bond Trust (BHK) BlackRock Credit Allocation Income Trust (BTZ) BlackRock Resources & Commodities Strategy Trust (BCX) BlackRock Taxable Municipal Bond Trust (BBN) Wells Fargo Advantage Multi-Sector Income Fund (ERC) Nuveen Premium Income Municipal Fund 2 Inc. (NPM) Nuveen Premier Municipal Income Fund (NPF) Nuveen Premium Income Municipal Fund Inc (NPI) Nuveen Quality Preferred Income Fund (JTP) MFS Multimarket Income Trust (MMT) Invesco Municipal Trust (VKQ) Western Asset/Claymore Inflation-Linked Opportunities & Income Fund (WIW) Brookfield Mortgage Opportunity Income Fund (BOI)1. Bought 50 BBN at $20.26
Trade Snapshot ($1 Commission):

The net asset value per share increased by 6 cents on 10/9 with the share price declining 2 cents.
Closing price 10/9/15: BBN: $20.20 -0.02 (-0.10%)
Security Description: The
BlackRock Taxable Municipal Bond Trust (BBN) is a leveraged closed end fund that owns taxable municipal bonds issued under the expired Build America Bond program.Last SEC Filed Shareholder Report: BlackRock Build America Bond Trust for the period ending 7/31/15 (accumulated net unrealized appreciation=$231+M and capital loss carry forward at $40.1+M-page 24, the average weighted borrowing cost was .54% for the year ending 7/31/15 using reverse repurchase agreements-page 22; a rise in the FF rate will raise that borrowing cost number)
Data as of Date of Trade:
Closing net asset value per share: $22.19
Closing Market Price: $20.2
Discount: -8.97%
Historical Average Discounts:
1 Year: -8.19%
3 Years: -7.25%
5 Years: -5.81%
Dividend: The fund is currently paying a monthly dividend of $.1318 per share.
BalckRock Taxable Municipal Bond Trust (BBN) Dividend HistoryBBN went ex dividend for its distribution on 10/13, shortly after my purchase.
Assuming a continuation of that penny rate, and a total average cost per share of $20.26, the dividend yield would be about 7.81%.
I received a complaint from a reader in my post discussing the purchase of VKQ, who asserted that some recent haircuts to the dividend penny rate was some kind of "red flag". Update For Closed End Fund Basket Strategy As Of 9/25/15 - South Gent | Seeking Alpha
Although I gave a link for anyone to follow about that CEFs dividend history, I apparently committed some offense by failing to discuss that history. In other words, my posts need to be longer than they already are and the investor has to be spoon fed on every detail. Each investor needs to perform their own due diligence. So I will add these words here after providing a link to BBN's dividend history. BBN has not cut the dividend rate-YET.
In the appendix section below, I will drag and drop my edited response, which is focuses on the reality of leveraged bond CEF payouts and the factors that would govern a decision on whether cuts can be characterized in that manner.
I did not personally view the dividend history of VKQ as raising a red flag.
Placement and Tax Issues:
For taxpayers in a relatively high marginal tax bracket, it would make more sense to buy a BAB fund in a retirement account and a tax free municipal bond fund in a taxalbe account.
The BAB fund will not be paying qualified dividends. The tax character of the "dividend" payment to shareholders takes on the classification at the fund level which is ordinary taxable interest income. When I examine that issue, I assume that the payment is being taxed at my highest marginal tax rate when bought in a taxable account.
In the past I have bought BAB funds mostly in the ROTH IRA. In the ROTH, the % dividend yield, referenced above, becomes tax free and that is a high tax free yield for a high quality bond portfolio.
Since I am retired with no earned income, and my only pension is SS, I am less concerned about this placement issue now.
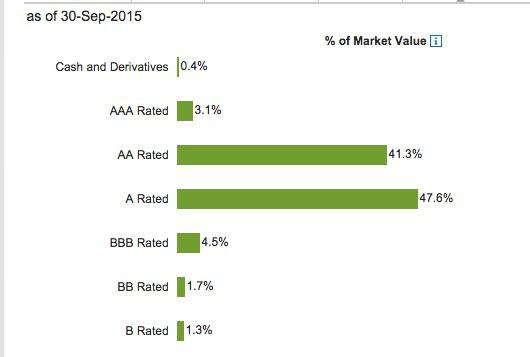
Credit Quality: The credit quality is high as shown in the following table:
DURATION:
Just to formulate an idea about how a bond fund will react, the general rule of thumb is to multiply the fund's duration by the percent change in interest rates.
The duration data for BBN can be found at the sponsor's webste: Taxable Municipal Bond Trust | BBN
As of 9/30/15, the effective duration was 11.34 years. Blackrock claims that this duration number has been adjusted to reflect the impacts of leverage and hedging.
It immediately becomes apparent looking at that number that a 2% rise in interest rates at this duration number would result in about a 22+% loss in value. Conversely, a 2% decline in rates would result in about a 22+% gain.
The long duration of BABs mean interest rate sensitivity is really high in both directions. So, I view them as being on the dangerous side of the ledger, given the fact that we are already deep into a long term bull market in bonds that started 33+ years ago. I consequently have had a hair trigger on every BAB fund that I have bought for several years now.
I have snapshots of my round trip transactions and links to prior discussions in the Appendix section below.
I had previously eliminated my BAB fund positions earlier this year-again-due to interest rate risk concerns. Since those concerns have abated some, I started back with just a little toe deep with this 50 share purchase. I went with BBN over the two Nuveen funds that I normally trade due to its higher current yield.
Unhedged Leverage increases duration. The fund was leveraged at 35.91% as of 9/30/15.
See also:
Duration-What an Interest Rate Hike Could Do to Your Bond Portfolio-FINRA.org
Understanding Duration in Bond Funds.pdf
Importance of Discounts Over History:
When buying and selling leveraged bond CEFs, I will consider buying when the current discount to net asset value significantly exceeds the long term average and then consider selling when the discount contracts below that average. There are many other variable that enter into the equation including the possible increases in borrowing costs due to the FED raising the federal funds rate and the outlook for inflation which is the primary enemy of bond investors. The net asset values of a bond fund with a long duration, such as BBN, will be significantly impacted by relatively small changes in long term rates.
Average historical discounts can be found under the "Pricing Information Tab" at CEFConnect. There is a chart at that page which shows historical discounts to net asset value over several time periods, which always needs to be examined prior to making a purchase. I can expand that chart to cover the fund's entire history.
The Erratic Movement of Market Price to Net Asset Value Per share:
Generally, there is no shortage of opportunities to buy at higher than normal discounts and to sell at lower than normal discounts.
The problem is to assess the likelihood that both the net asset value per share will increase at the same time as a contraction in the discount after purchase. That is what I call the twofer, and the optimal goal in CEF trading. The optimal goal is simply to harvest the dividend without losing money on the shares over time. There will be times when I can harvest share gains and periods where that is just impossible to do. I keep track of my trading history to see whether I am adding alpha to a simple buy and hold strategy for this income generating class of securities.
I went through a round of profit taking in both bond and stock CEFs throughout 2014 and into 2015.
Update On Closed End Fund Basket Strategy As Of 7/28/15 - South Gent | Seeking Alpha (net realized gain=+$2,604.98/bringing one year total up to + $12,081.65 plus dividends)
In two other updates, I referenced selling activity that generated $6,678.68 in profits: Update For Closed End Fund Portfolio As Of 4/8/15 - South Gent | Seeking Alpha (+$4,073.7) and Closed End Fund Portfolio: Update - South Gent | Seeking Alpha (11/1/2014)(+5,402.97)
BBN started operations in 2010 and was initially selling at a premium to net asset value per share. The chart highlights the erratic movement of the market price to net asset value per share.
I have mentioned several times here that bond CEFs experienced a discount expansion in the May 2013-December 2013 time frame, which is shown in the BBN chart.
Most of them are still in recovery due to the expected reactions of individual investors when a bond CEF goes down in net asset value.
The market price percentage loss during that period will generally be around twice the percentage loss in net asset value per share, with the difference moved to an expansion of the discount.
When interest rates started to decline in 2014, BBN floated down toward its long run average near 5%-just eyeballing the chart to make that guess, but quickly reversed that decline even though intermediate and longer term interest rates continued to move down throughout 2014 and into 2015.
The most recent low was a -4.39% discount on 5/4/15 created by a net asset value per share of $23.22 and the market price at $22.2.
Unadjusted for subsequent dividends, the net asset value declined by 4.43+% and the market price declined 9% between 5/4 and 10/9.
Comparison with Build America Bond ETFs Using Net Asset Value Per Share:
I have just shown BBN's volatile nature of market price in relation to net asset value. I would call that volatility about average for a leveraged bond CEF.
I now want to look at whether the BBN managers are adding or subtracting value compared to a dumb index fund. I can not perform that analysis by comparing total return performance numbers, with and without dividend reinvestment, due to the noise created by the moving target discount numbers.
And, since the leveraged CEF is generating more income than the unleveraged ETF, I have to make a comparison using total return based on net asset value.
I will just use Morningstar's total return numbers based on both net asset value per share and market price which takes into account dividend reinvestment.
There are two BAB ETFs:
SPDR Nuveen Barclays Build American Bond ETF (BABS) PowerShares Build America Bond Portfolio Fund (BAB)The following numbers use annualized average total returns for periods in excess of 1 year and include returns through 10/9/15:
SPDR® Nuveen Barclays Build America Bond ETF (BABS) Total Returns PowerShares Build America Bond ETF (BAB) Total Returns BlackRock Taxable Municipal Bond Trust (BBN) Total ReturnsBased on Net Asset Value Per Share:
YTD/1 Year/3 Years/5 Years
BBN: -3.49%/+.78%/5.25%/+10.5% (annualized)
BABS: -2.19%/.66%/+3.97%/+7.82%
BAB: -.028%/+1.76%/+4.1%/+7.01%
Based on Market Price:
BBN: -4.47%/+.89/+3.41/7.87%
BABS: -3.55%/-.83%/+3.71%/+7.52
BAB: -.85%/+2.02%/+4.02%/+7%
I would make the following observations about those numbers:
1. A fund using leverage will go down more than the comparable ETF when the substantial number of securities bought with borrowed money go down in price. Consequently, I would anticipate that BBN would probably underperform BABS and BAB when the bonds are declining in value. The YTD underperformance based on net asset value per share is not significant and understandable.
2. The use of leverage and a rise in bond prices are the most optimal conditions for BBN to outperform when borrowing costs are stable or trending down. BBN's annualized total return performance based on net asset value is significantly higher than the two ETFs over a 3 and 5 year period. BBN's excess annualized average return compared to BAB over five years was 3.49% which is very high for a bond fund.
3. Even though BBN is selling now at a higher than historically normal discount, the market returns still exceed the annualized total returns for the ETFs over a 5 year period. Part of that is due to the superior dividend yield which is invested at a wide variety of discounts.
4. A contraction or expansion of the discount can improve and or detract from BBN's more recent total return numbers. The one year total return number for BBN could exceed the two ETFs with a small contraction in the discount to 7% from almost 9% now.
5. A rise in borrowing costs will pressure BBN's dividend payout by reducing the yield spread between the borrowed funds and the bonds bought with those funds. The ETFs are unleveraged. In this scenario, the yield advantage for the leveraged CEF decreases.
6. If short term interest rates rise in tandem with intermediate and longer term rates, the discount of the leveraged bond CEF is likely to expand at a faster rate than the decline in net asset value. The decline in net asset value will be accelerated by the use of leverage. That is the worst possible scenario for a leveraged bond CEF.
(A) the dividend shrinks and
(B) the value of the bonds go down in price including those bought with lots of borrowed money (throwing gasoline on a fire), which also raises the risk that the fund will have to deleverage by selling assets into a declining market;
(C) the discount widens increasing the market price losses
In short, there is no free lunch when buying leveraged bond CEFs. They have had the wind at their bank for several years now as borrowing costs have declined in an ongoing (though erratic) bull market in bonds.
I also discuss an unusual risk associated with BAB funds in the Appendix section below.
The most important risk at the moment relates to a potential rise in short term interest rates and longer term rates that would adversely impact the value of vintage long bonds.
APPENDIX:
1. Factors Impacting a Dividend Payout for Leveraged Closed End Bond Funds Using VKQ as an Example:
Interest rates have trended down for several years now.
For any bond fund, I would expect the dividend rate to trend down as the proceeds from maturing bonds are reinvested in lower yielding securities.
The bond fund's coupon may also be adversely impacted by an increase in borrowing costs and the willingness of the fund's managers to support the dividend with a return of capital.
That happened with this fund in 2012. The fund redeemed the auction rate preferred shares between 5/24/12 through 6/4/12 (page 27: SEC Filed Shareholder Report) The reasons are not given by the fund although the ARPs shareholders had been screwed since the ARP auctions started to fail in early 2008. That resulted in a significant increase in borrowing costs and consequently a reduced yield spread that consequently the income available for distribution. For the period ending 2/28/15, the the average annualized dividend rate of the Variable Rate Muni Term Preferred Shares was 1.20%: Page 35. N-CSR - VKQ
Another issue is whether the fund supports a dividend with capital gains distributions or distributes those gains in a special distribution.
Another issue is whether the manager is increasing or reducing duration. Longer term bonds are more sensitive to changes in rates, up and down, and have higher yields than similarly rated shorter term bonds. A manager could cut the interest payments to the funds by selling long duration bonds and buying shorter term ones, thereby reducing the sensitivity of the portfolio to a rise in rates. Alternatively, the manager could be increasing the duration some which would generate more income.
Any or all of the foregoing can cause variations in the dividend penny rate.
VKQ has maintained the distribution at $.68 since 6/11/14.
The rate was gradually cut from $.08 which was first effective for the 2009 4th quarter and lasted until the November 2012 payment, but that $.08 rate was the result of a gradual rise from $.063 effective for the 2006 second quarter which is by the way lower than the current rate. The $.063 rate was hit after several cuts from $.078 in effect as 2/13/2002. And that $.078 rate represented a rise in stages from $.0685 in effect from the 2000 4th quarter. The $.0685 rate was the result of a cut from $.071.
Another factor to examine before reaching a red flag opinion is whether the fund was merged with another one that impacted the dividend rate. I know that this fund was originally managed by Van Kampen Investments which was acquired by Invesco on 6/1/2010.
"At a shareholder meeting held on September 25, 2012, shareholders of the Trust approved the merger of each of Invesco Van Kampen Massachusetts Value Municipal Income Trust, Invesco Van Kampen Ohio Quality Municipal Trust and Invesco Van Kampen Trust for Investment Grade New Jersey Municipals (the "Target Funds") into the Trust. Shareholders also approved the redomestication of the Trust to a Delaware statutory trust. The redomestication and mergers were completed on October 15, 2012, and common shares of the Target Funds were converted into newly issued common shares of the Trust. VMTP shares of the Target Funds were converted into newly issued VMTP shares of the Trust. In addition, the Trust will change its name to "Invesco Municipal Trust" effective December 3, 2012."
This factor did not apparently impair the dividend which was maintained at $.08 per share.
To me, this history indicates the monthly dividend rate moves up and down based on a variety of factors which are well known to informed investors. Some investors confuse ROC supported dividends with earned dividends and consequently will sell a CEF who cuts the dividend to bring it in line with income.
There was a special distribution of $.3126 in December 2005 which included the regular dividend of $.0695 per share.
Invesco Municipal Trust (VKQ) Dividend Date & History - NASDAQ.comIf the special dividend had instead been added to the monthly payout at the rate of 1 cent per share, it would have increased the monthly payout by that 1 cent for over 2 years.
So what appears to be subsequent cuts in the monthly rate were largely covered by that special distribution.
2. Prior Build America Bond CEF Trades:
I am citing the Marketwatch quote page and their dividend yield calculations at the closing prices last Friday:
Guggenheim Build America Bonds Managed Duration Trust Stock (GBAB)/MP $21.65/Yield 7.66%/Discount: -4.79% CEFConnect Nuveen Build America Bond Fund (NBB)/MP $19.55/Yield 6.87%/Discount: -7.78% CEFConnect Nuveen Build America Bond Opportunity Fund Stock (NBD)/MP $19.47/Yield 6.69%/Discount: -9.34% CEFConnect BlackRock Taxable Municipal Bond Trust (BBN)/MP $20.2/Yield 7.83%/Discount: -8.72% CEFConnectA. BBN: +$224.76
I have only one prior BBN trade:
Item # 5 Sold 100 BBN at $20.51-ROTH IRA (11/10/11 Post)-Item # 4 Bought 100 of the Bond CEF BBN at $18.15 (7/29/11 Post)

B. GBAB: +$47.78
Bought 100 of the Bond CEF GBAB at $18.2 (3/23/11 Post)
![]()
C. NBD:
1/22/2015 Disposition: +$71.07
![]()
Item # 3 Sold 100 NBD at $22.22-Taxable Account (1/24/15 Post)-Item # 1 Bought Back 100 NBD at $21.35 (11/3/2014)
5/22/2013 Roth IRA Disposition: +$42.33
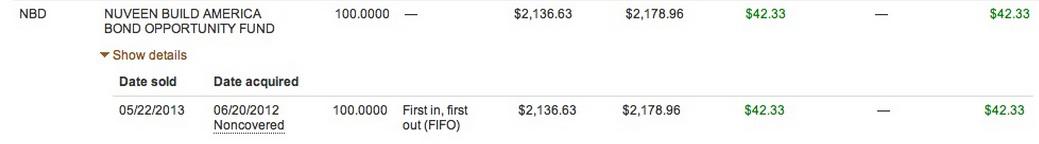
Item # 3 Sold 100 NBD at $21.86-Roth IRA (5/29/13 Post)-Item # 2 Bought 100 of the Bond CEF NBD at $21.29-Roth IRA (6/21/12 Post)
Item # 7 Sold 100 NBD at $22 (2/27/13 Post){"I mentioned in a recent post that I would be selling the shares owned in a taxable account as I transition to owning this fund (and NBB) in retirement accounts; profit +4.17}- Item # 2 Bought 100 NBD at $21.8 (9/11/12 Post)
D. NBB:
2/6/15 Roth IRA Disposition: +$101.7

6/20/14 Disposition +$91.33

1/8/14 Disposition: +$40.62:
![]()
Item # 2 Bought 100 NBB at $20.85-Regular IRA (2/6/13 Post)
11/1/11 Disposition =+$49.61
![]()
11/18/11 Roth IRA Disposition: +$108.97
Item # 1 Sold 100 NBB at $20.13-ROTH IRA November 2011 and Item # 3 Sold 100 NBB at $20.07 November 2011
12/1/2010 Regular IRA Disposition: +$25.58

Item # 1 Sold 50 NBB at $19.24 in the Regular IRA December 2010--Item # 5 Bought: 50 NBB at $18.4 (11/18/2010 Post)
TOTAL REALIZED GAINS CEF BAB FUNDS: +$807.92 (excludes dividends)
E. BAB (an ETF): Item # 2 Sold 50 BAB and Bought 100 of the Bond CEF GBAB at $18.2 (2/23/2011 Post)
I highlighted an unusual risk in BABs back in 2012 that I will just summarize here:
Another risk for BAB owners arises from the upcoming fiscal cliff. If nothing is done to change current law, then there will be across the board sequestration in the federal government's expenditures on 1/1/13. The federal government pays 35% of the BABs interest in lieu of granting the tax exemption. Part of those funds would be sequestered, estimated at about 7.6% of the subsidy, a number that originates from a report prepared by the Office of Management and Budget. While that would not cause an issuer to default, some issuers have reserved the right to call BABs if the government fails to pay its subsidy. If an issuer is able to do that at par value, and the bond is selling at over par now, there would adversely impact BAB funds.
If Congress fails to extend the debt limit, and the nation is bumping up against that number now, then the U.S. could default on its obligations to subsidize the BABs.
Disclaimer: I am not a financial advisor but simply an individual investor who has been managing my own money since I was a teenager. In this post, I am acting solely as a financial journalist focusing on my own investments. The information contained in this post is not intended to be a complete description or summary of all available data relevant to making an investment decision. Instead, I am merely expressing some of the reasons underlying the purchase or sell of securities. Nothing in this post is intended to constitute investment or legal advice or a recommendation to buy or to sell. All investors need to perform their own due diligence before making any financial decision which requires at a minimum reading original source material available at the SEC and elsewhere. A failure to perform due diligence only increases what I call "error creep". Stocks, Bonds & Politics:ERROR CREEP and the INVESTING PROCESS. Each investor needs to assess a potential investment taking into account their personal risk tolerances, goals and situational risks. I can only make that kind of assessment for myself and family members.