This topic was last update only a few days ago: Update For Portfolio Positioning And Management As Of 1/12/2016 - South Gent | Seeking Alpha
I am publishing this topic out of order again given its relative importance compared to the other updates. The next update, which will be the REIT basket strategy, was postponed in order to write this one.
CONFIRMATION EVENT:
The VIX Model worked again. The "Vix Asset Allocation Model" is a mechanical model that does not depend on any inputs other the VIX's movements. It churns out its signals without regard to whether or not I want to hear them, act upon them, or agree with them based on Left Brain's opinions formed after assembling and evaluating real world information on hundreds of relevant topics and mutiple possible scenarios.
The Confirmation Event is a spike in volatility occurring after a Trigger Event that confirms the Trigger Event as a valid sell signal. I am now calling this movement a Confirmation Event.
January 2016 Confirmation Event:
1/20/16 27.59 (high of 32.09/low 26.5)
1/19/16 26.05
1/15/16 27.02
1/14/16 23.95
1/13/16 25.22
1/12/16 22.47
1/11/16 24.3
1/08/16 27.01
1/07/16 24.99
1/06/16 20.59
1/04/16 20.7 (initial burst over 20)
VIX Historical Prices | VOLATILITY S&P 500
The VIX may continue confirming the Confirmation Event for a period of time.
I am giving some minor weight to intra-day movements above 26 when the VIX closed below that level; two intra-day highs over 30; and 4 closes over 20 in mid-December 2015 with the highest being at 24.39 which occurred 5 trading days after a 14.67 close. The forgoing data are inconsistent with a SVP formation and are only consistent with prior terminations of the SVP day count.
The Confirmation Event also clearly and unequivocally terminates the Recovery Period and requires a restart of the Stable Vix Pattern day count. The SVP day count is now at zero.
The formation of the SVP requires in my Model 90 days of movement below 20. That is a safety valve that was built into the Model to avoid a false buying signal and is a recognition that the Unstable Vix Pattern ("UVP') will have temporary VIX movements below 20.
The market is currently in a UVP.
The UVP's duration is not known or knowable in advance, though a UVP has lasted several years with the longest being close to 6 years.
A sell made during the First Recovery period after the October-December 1997 TE, which started on 2/18/1998 and lasted until March 23, 1998, would have been at a significantly higher SPX level than that prevailing in 2002. SPX closed at 1099.16 on 3/20/1998. The closing bottom level was on 7/23/2002 at 790.7: Historical Prices | S&P 500 Waiting until the SVP formation in late 2003 would have been about 50 or so points lower than First Recovery Period high water mark back in March 1998.
The latest Trigger Event ("TE") occurred last August: A Trigger Event In The Vix Asset Allocation Model 8/31/15 - South Gent | Seeking Alpha The TE is a spike in volatility lasting for several days occurring after a long period of VIX movement below 20. The steady and long term movement below 20 is called the Stable Vix Pattern.
The prior TE occurred seven years earlier: Stocks, Bonds & Politics: VIX Chart from 2007: Alerts and Triggers Major Disruption of Cyclical Stable Bull VIX Pattern
The Trigger Event is a typical descriptive term used in the Model.
It is a "trigger" for an investor to consider (at a minimum) making significant changes in their stock allocations and to research what may have caused the TE: Update For Portfolio Positioning And Management As Of 9/1/15 - South Gent | Seeking Alpha (scroll to "What The Trigger Event Requires" "TRIGGER EVENT: WHY?")
After the most recent Trigger Event, the VIX returned to movement below 20. That movement is called an Anticipated Event ("AE") in the Model.
The movement below 20 after the TE is called the Recovery Period ("RP").
As I explained to Mark Hulbert in an email exchange several years ago, a return to movement below 20 in this context is a sell the rally event. Mark Hulbert and the Use of the VIX as a Timing Model (10/10/11 Post)
The RP started on October 5, 2015.
Once the UVP starts in motion, the Model suggests that an investor consider selling into the RP rather than the TE and its immediate aftermath. That worked just fine after the August 2007 TE and in prior TEs. In other words, the first RP after the Trigger Event is likely to be both the first and last best opportunity to sell. The bulls have historically mounted an impressive charge after a TE.
In addition to lightening up on the stock allocation, the Model suggests that the investor buy hedges during the RP. I am a cash only long investor so my hedge buying was limited to a much disfavored product known as a double short ETF. Based on prior RP time periods after a Trigger Event, I decided to buy SDS several times, waiting for a window between 18 to 22 trading days after the RP's start. Those buys were in the $19.2 to $19.5 range.
I have now sold all of those SDS purchases, as suggested by the Model. I also sold stock positions during the Recovery Period raising my cash allocation to about 40%.
My Trading Strategy in the UVP: While the UVP suggests a trading playbook, it is still incumbent upon each investor to tailor their strategy based on an unbiased assessment of their situational risks, tolerances for pain and even their patience. The UVP is after all a roller coaster that ends up depositing the investor back where they started after delivering chills and thrills and little else.
My trading strategy during a UVP was first developed after the August 2007 TE and was tailored to my own personality foibles, a total lack of situational risks, a propensity toward capital preservation and income generation, my overall trouble in the patience department, and the need to force buying when I would really have preferred hiding under the covers (i.e. blood flowing in the streets).
I will use some rudimentary technical analysis in conjunction with my trading strategy. The most common is the SPX's movement 5% above or below its 200 day SMA line. See: Vix Asset Allocation Model - South Gent | Seeking Alpha (scroll to "Use with 200 Day SMA S & P 500 Crossovers")
Currently, I am using a piercing of the October 2014 closing lows as a Time Out signal which I will flesh out shortly here.
Left to Right: Open/High/Low/Close/Volume
| Oct 16, 2014 | 1,855.95 | 1,876.01 | 1,835.02 | 1,862.76 | 5,073,150,000 | 1,862.76 |
| Oct 15, 2014 | 1,874.18 | 1,874.18 | 1,820.66 | 1,862.49 | 6,090,800,000 | 1,862.49 |
There were two successive closes that month at 1862+.
Those lows were successfully tested in August 2015 (support at 1867):
| Aug 25, 2015 | 1,898.08 | 1,948.04 | 1,867.08 | 1,867.61 | 5,183,560,000 | 1,867.61 |
| Aug 24, 2015 | 1,965.15 | 1,965.15 | 1,867.01 | 1,893.21 | 6,612,690,000 | 1,893.21 |
Today, the SPX blew through that support. This index's chart looks awful as well, Chart, which is expected during corrections and bear markets.
While the bulls mounted a meaningful charge off a daily double bottom in the 1812 to 1814 range, the rally was turned back near the close resulting in a 1859.22 close.
The issues then become whether 1862/1867 now becomes a new ceiling and whether the 1820 level (the intra-day low from 10/15/2014) will be taken out soon. I would view the risk still to be down, though I did recently state here than a fall below SPX 1700 would not be rational unless several feared bad events actually occur (e.g. a 20% Yuan devaluation, major and/or widespread sovereign defaults, a worldwide recession that takes the U.S. down as well; a major spreading of E & P credit defaults into other sectors, etc., a hard landing in China, depressionary conditions enveloping several important developed nations etc.).
The August/September downdraft was a warning shot across the bow which went unheeded by many who viewed it as a necessary correction in an ongoing bull market or just letting off some steam.
That assessment could prove to be accurate when viewed in terms of long term patterns measured in years rather than months.
There will be corrections and even cyclical bear markets in long term secular bull markets, but the dominant long term trend would still remain up.
The October 1987 crash was a cyclical bear market that ushered in a going sideways pattern for almost 4 years, but that entire sequence was a mere interlude in a long term secular bull market that had started in August 1982 that produced a 15.506% average annual total returns adjusted for inflation (start July 1982-end March 2000 S&P 500 Return Calculator - Don't Quit Your Day Job...)
I am personally still in the camp that conditions are present to power a long term secular bull market, notwithstanding the obfuscation presented by current events or the tendency of many to blow negative events out of proportion and to reduce powerful and positive data sets to meaningless gibberish subsumed by whatever is viewed at the time as the only thing that really matters.
However, I would emphasize my opinion about a long term secular bull market does not help much, and utterly fails to reduce the pain, when a $1M portfolio goes down $250K over a short period of time in one of the periodic market bloodlettings, which after all just go with the territory for those who have been around for awhile. The bloodlettings are normal and are expected to happen. When, how much and how long are always the only questions.
Time Out: The purpose of a brief time out is to wait and see whether the bottom falls out with a VIX super spike. Some would call that type of event "blood in the streets". The Model refers to it as a Catastrophic Event. I am in a time out period now, which puts a heavy lid on stock buying.
The Time Out resulted from a closing break below 1862.
During the Time Out, I can invest in bonds and preferred stocks; and I can buy common stocks under the following guidelines which are identical to the rules in place between September 2008 to February 2009 when Right Brain engineered a coup d'état, with its only ally being the frequently confused Old Geezer, dethroning Left Brain as HQ's Head Trader. The RB proceeded to throw caution to the wind and to break all of LB's stinking rules as documented in the daily minutes of HQ's trading operation, otherwise known as my old blog. Stocks, Bonds & Politics
(1) I can buy stock with cash flow or the proceeds received from selling another security or a bond redemption. I can not dip into the existing cash allocation.
Reinvestable Proceeds:
I recently sold my SDS positions, the REITs Realty Income (O) and Inland Real Estate (IRC). The Realty Income position was sold today:
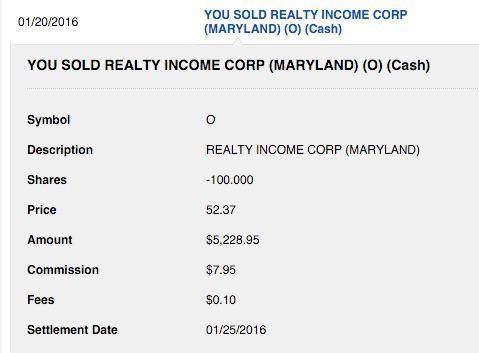
Those shares were bought in December 2013:
Item # 6 Bought: 100 Realty Income (O) at $36.96 (12/10/13 Post) I will discuss this disposition in my next REIT update. Realty Income has risen in price so far this year. The close on 12/31/15 was at $51.63 and I sold at $52.37: O Historical PricesClosing Price 1/21/16: O: $51.87 -1.14 (-2.15%)
2016 Consensus FFO Per Share Estimate Per Share: $2.86
P/FFO at $2.86 and $52.37 Price=18.31
Realty Income Announces Dividend Increase Of 5%: Jan. 14, 2016
The new monthly rate is $.1985 per share or about a 4.55% yield based on an all-in $52.37 price. For a 100 share lot, that rate would result in an annual dividend payment of $238.2. This stock was held in a taxable account. I will have a profit snapshot in my REIT update but it will be around $1500 or over 6 years of dividend payments at the current rate.
In 2014, I received $165.6 in non-qualified dividends and $54.02 in dividends classified as ROC which I just recaptured as a long term capital gain. I received $228.22 in dividends in 2015. The final tax characteristics of those dividend payments was released today by Realty Income. Realty Income Announces 2015 Common Stock Dividend Tax Allocation The profit snapshot will not include the cost basis adjustment for the 2015 dividend ROC.
In a few days, I will receive the redemption proceeds from 2 Office Depot bonds ($2,000). To use an estimated number, I had about $13K available for stock purchases.
I have already reinvested the IRC proceeds and part of the Office Depot bond proceeds as discussed here. Update For Equity REIT Basket Strategy As Of 1/11/16 - South Gent | Seeking Alpha Those two securities have or will generate proceeds totaling $4,169.74; and I reinvested $2,068 of that amount in 50 IRM shares and 100 LXP shares.
I then used that $2,068 up and $400 more buying odd lots of three regional bank stocks. Update For Regional Bank Basket As Of 1/19/16 - South Gent | Seeking Alpha So I have about $8,500 give or take a few bucks to buy stocks now without dipping into my cash allocation, plus cash flow.
Today, I did not buy any stocks. I did add 50 shares of an investment grade exchange traded bond which will be discussed in my next bond update. Yesterday, I bought 50 shares of another exchange traded bond. So I am recognizing the inherent volatility with a downward bias for bonds that can be bought as easily as stocks by Mom and Pop investors and frequently start to act like a common stock during periods of stock market turmoil.
Disclaimer: I am not a financial advisor but simply an individual investor who has been managing my own money since I was a teenager. In this post, I am acting solely as a financial journalist focusing on my own investments. The information contained in this post is not intended to be a complete description or summary of all available data relevant to making an investment decision. Instead, I am merely expressing some of the reasons underlying the purchase or sell of securities. Nothing in this post is intended to constitute investment or legal advice or a recommendation to buy or to sell. All investors need to perform their own due diligence before making any financial decision which requires at a minimum reading original source material available at the SEC and elsewhere. A failure to perform due diligence only increases what I call "error creep". Stocks, Bonds & Politics:ERROR CREEP and the INVESTING PROCESS. Each investor needs to assess a potential investment taking into account their personal risk tolerances, goals and situational risks. I can only make that kind of assessment for myself and family members.