The last few days have not been kind to regional bank stocks. The SPDR S&P Regional Banking ETF closed at $38.92 today, down from a $41 close last Wednesday. The decline has been correlated with a slide in interest rates and overall U.S. stock market weakness.
The 10 year treasury closed at a 1.91% yield on 4/25 and at 1.79% today. Daily Treasury Yield Curve Rates
Closing ETF Prices 5/4/16:
KRE: $38.92 -0.73 (-1.84%): SPDR S&P Regional Banking ETF
SPY: $205.01 -1.15 (-0.56%): SPDR S&P 500 ETF
TLT: $130.14 +0.71 (+0.55%): iShares 20+ Year Treasury Bond ETF
VNQ: $84.42 +1.19 (+1.43%): Vanguard REIT ETF
VPU: $107.49 +1.32 (+1.24%): Vanguard Utilities ETF
+++++++
This basket was last updated here: Update For Regional Bank Basket Strategy As Of 4/19/16 - South Gent | Seeking Alpha
This basket has a minimum out-of-pocket exposure of $40K and a maximum of $80K. For the last six months or so of 2015, I was hovering around $4K to $6k below my minimum level for the reasons discussed here:
Update On Regional Bank Basket Strategy As Of 7/17/15 - South Gent | Seeking Alpha
With several recent and small adds, I have moved $14K+ over my $40K minimum level.
My net realized gain in this basket strategy currently stands at $25,666.64 (small lot trades): REGIONAL BANK BASKET STRATEGY GATEWAY POST I started to build this basket in the 2009 Spring.
Snapshots of round trip trades can be found at the end of that post.
Over the life of this basket strategy, I anticipate that dividends will generate about 40% of my total return. Over the past 4 years ending 12/31/15, dividends have averaged $1,939.37 per year.
The dividend yield of this basket is significantly in excess of the yields provided by regional bank ETFs that include a large number of low yielding stocks and several that pay no dividends.
Charge-offs for regional banks are near historical lows in the aggregate and NPL's are trending below 1% for the banks that I will buy as part of this basket strategy. Loans and deposits are increasing at favorable percentages. The problem remains NIM contraction. While NIM is showing signs of stabilization there is still not much hope yet on the horizon for a meaningful improvement.
FRB: FEDS Notes: Why Are Net Interest Margins of Large Banks So Compressed?
Basket as of 5/4/16
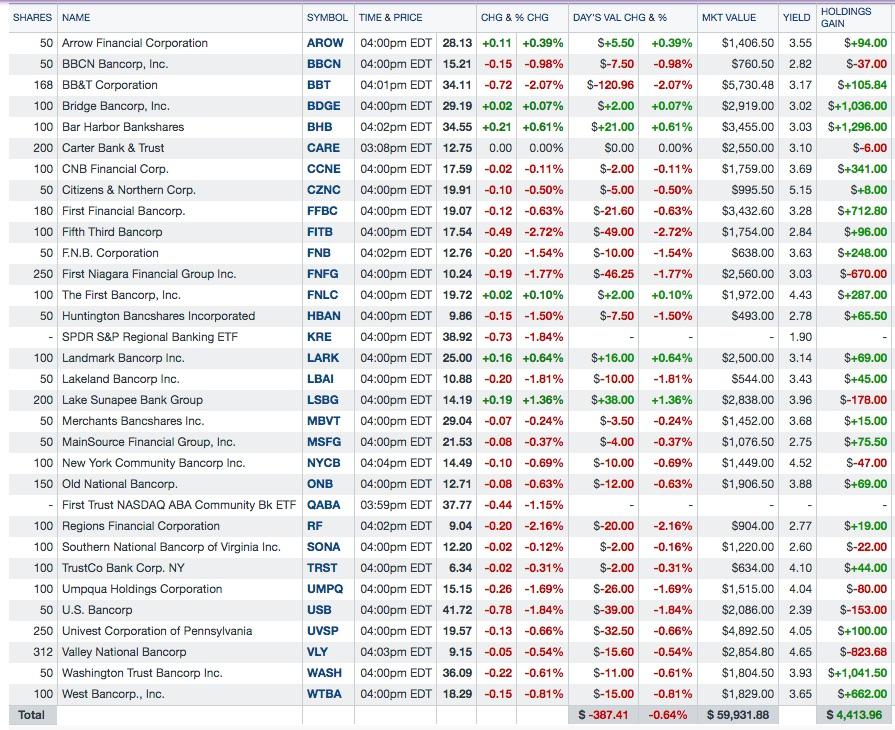
My basket performed better today than KRE and QABA.
I am not tracking shares bought with reinvested dividends in the preceding table.
++++++++++++
1. Bought 50 BBCN at $15.95:
Trade Snapshot ($1 Commission):

Quote:
BBCN Bancorp (BBCN)Company Description:
BBCN Bancorp Inc. (BBCN) is a bank holding company that conducts banking operations through its wholly owned subsidiary BBCN bank.BBCN is "the largest Korean-American bank in the nation with $8.1 billion in assets as of March 31, 2016. . . . BBCN operates 50 branches in California, New York, New Jersey, Illinois, Washington and Virginia; eight loan production offices in Seattle, Denver, Dallas, Atlanta, Northern California, Annandale, Virginia, Portland, Oregon and Fremont, California; and a representative office in Seoul, Korea." Corporate Profile › BBCN Bank
Proposed Acqusition of Wilshire Bancorp: BBCN Bancorp and Wilshire Bancorp Announce Strategic Merger of Equals
Wilshire strives to be more than just a bank for the Korean communities:
"Since our inception, we have successfully built our name and reputation in thriving multi-ethnic communities and are one of the few Korean-American banks to have both a multi-ethnic customer base and Board of Directors.
Headquartered in Los Angeles, California, Wilshire Bank operates 37 branch offices in California, Texas, New Jersey, and New York, as well as loan production offices across the country. " About Wilshire Bank
"Under the terms of the merger agreement, Wilshire shareholders will receive a fixed exchange ratio of 0.7034 of a share of BBCN common stock in exchange for each share of Wilshire common stock they own in a 100% stock-for-stock transaction valued at approximately $1.0 billion."
"The combined company will have the number one deposit market share position among Korean-American banks in California, New York, New Jersey, Washington and Alabama and the second largest deposit market share position in Illinois and Texas." The merger may run into difficulties due to that statement. Those difficulties may be resolved by disposing of some branches to a competitor.
BBCN forecasts a 14% accretion to 2017 earnings estimates.
The BBCN offer to acquire Wilshire was made after a smaller Korean bank called Hanmi Financial (HAFC) offered to acquire BBCN. Hanmi Financial Proposes to Combine With BBCN Bancorp The implied purchase price was then $19.98 per BBCN share.
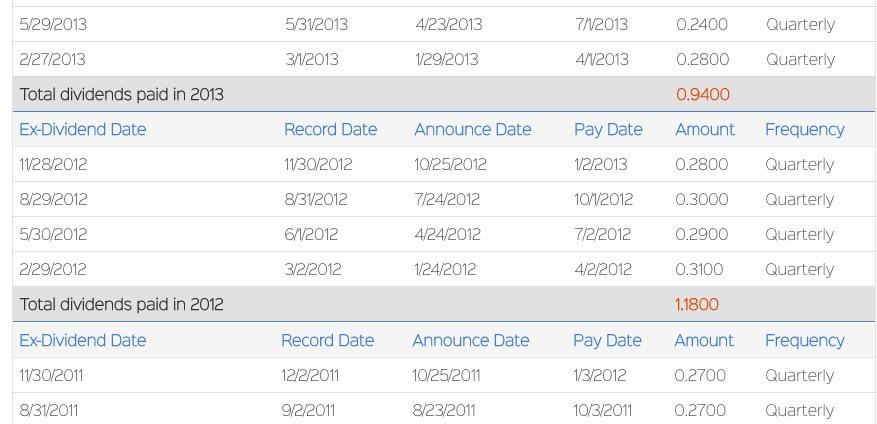
Dividends: BBCN went ex dividend for its quarterly distribution shortly after my purchase. BBCN Bancorp Declares Quarterly Cash Dividend of $0.11 Per Share
At that penny rate, the dividend yield is about 2.76% at a total cost of $15.95 per share.
The dividend rate was not cut in response to the Near Depression. However, the penny rate remained at .0275 for 19 quarters starting in 2004 second quarter. The raise off that level was to $.05 effective for the 2012 4th quarter and was then raised in increments to the $.11 quarterly rate.
The dividend growth rate since the last $.0275 payment, made on 1/15/2009, to $.11 is excellent at 300%, but that growth rate was off a low base. The dividend growth rate between 2004 and 2009 was practically non-existent.
Last Earnings Report for BBCN: For the 2016 first quarter, BBCN reported net income of $23.6 million, or $0.30 per diluted common share, up from $21.4M or $.27 per share in the 2015 first quarter.
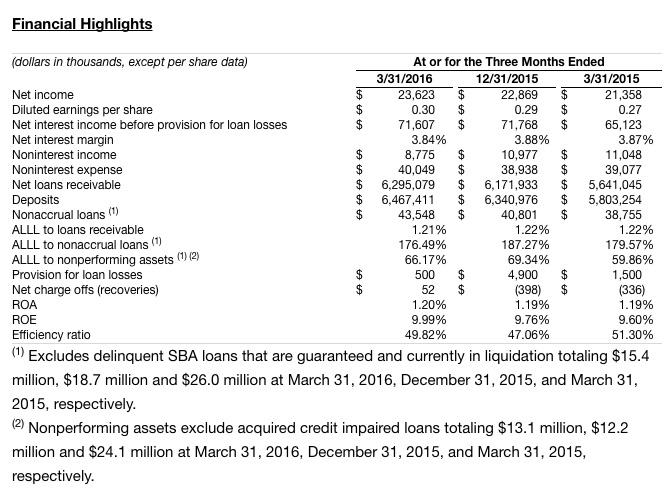
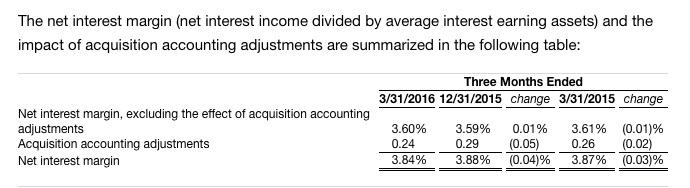
NIM is shown as 3.84% in the preceding table. However, acquisition related adjustments (accretion of loan discounts) added .24% so core NIM was 3.6% which is good compared to other banks.
BBCN's NPL and NPA ratios are high compared to other banks that I own, which is one reason for the odd lot purchase (most likely the highest without checking everyone)
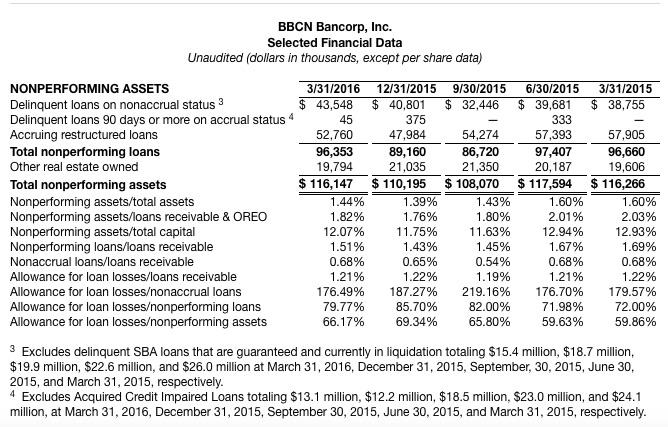
The capital ratios are okay:
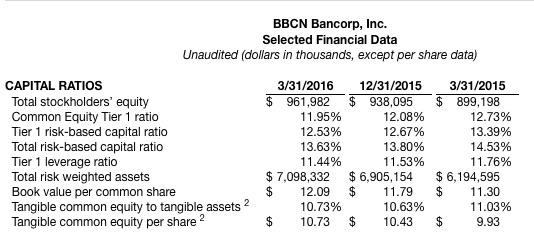
Based on a $15.95 share price, the market price to tangible book value per share ratio is about 1.49.
Prior Trades: Note for BBCN
Flips in WIBC: +$343.62
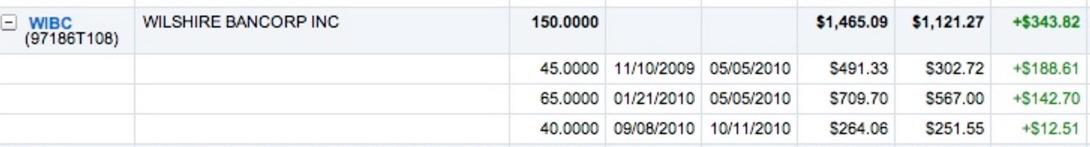
Sold 110 WIBC at $10.99 (5/6/2010 Post)-Bought 45 shares of WIBC at $6.54 and Added 65 Shares at $8.6
Sold 40 WIBC @ $6.8-Bought 40 WIBC at $6.09
Today's Close: BBCN: $15.21 -0.15 (-0.98%)
2. Added 50 NYCB at $14.75: This brings my position up to 100 shares in my IB account.
Trade Snapshot ($1 Commission)

Closing Price Day of Trade (5/3/16): NYCB: $14.76 -0.35 (-2.32%)
The stock was ex dividend on 5/4/16, so I will receive that quarterly payment on the entire 100 share lot.
I recently bought 50 in my IB trading account: Item # 1. Bought 50 NYCB AT $15.18: Update For Regional Bank Basket Strategy As Of 4/19/16 - South Gent | Seeking Alpha
The stock has slid since NYCB reported first quarter earnings.
Results were released prior to the opening on 4/20/16. The shares closed at $15.95 on 4/19 and declined 7.52% to my 5/3/16 purchase price of $14.75. NYCB Historical Prices The decline can not be attributable to general weakness in the regional bank sector though regional banks did get hit on 5/3: KRE: $39.65 -0.97 (-2.39%) The regional bank stock decline on 5/3 was positively correlated with a decline in interest rates which is an anticipated positive correlation when the decline in rates is material.
Closing Bond ETF Prices 5/3/16:
ZROZ: $121.81 +1.91 (+1.59%): PIMCO 25 Year Zero Coupon U.S. Treasury Bond ETF (longest duration in this grouping)
TLT: $129.43 +1.61 (+1.26%): iShares 20+ Year Treasury Bond ETF
BABS: $63.22 +0.78 (+1.25%): SPDR Nuveen Barclays Build America Bond ETF
IEF: $110.17 +0.65 (+0.59%): iShares 7-10 Year Treasury Bond ETF (shortest duration in this grouping)
The SPDR S&P Regional Banking ETF closed at $40.21 on 4/19 and at $39.65 on 5/3, or a 1.39% decline. So clearly, investors have reacted more negatively to NYCB's earning report than regional bank stocks in general.
I discussed NYCB's first quarter report in an earlier comment which I will simply repeat here.
NYCB missed the consensus expectations by a penny.
New York Community Bancorp, Inc. Reports 1Q 2016 Diluted GAAP Earnings Per Share of $0.27
Overall, I viewed the report positively based on the following metrics:
"The Company's efficiency ratio was 43.07% in 1Q 2016.
Non-performing non-covered assets totaled $64.6 million, representing 0.14% of total non-covered assets at 3/31/2016.
Non-performing non-covered loans totaled $49.2 million, representing 0.14% of total non-covered loans at that date.
Allowance for losses on non-covered loans to
non-performing non-covered loans = 302.77% (coverage ratio)
Return on average tangible stockholders' equity= 14.89%
Return on average assets = 1.05%
Return on average tangible assets = 1.11%
Operating expenses to average assets = 1.25%"
The Board declared a regular quarterly dividend of $.17 per share.
At that rate, the dividend yield is about 4.61% at a total cost of $14.75 per share.
3. Pared FFBC-Sold 50 at $19.25
Trade Snapshot (used a commission free trade)
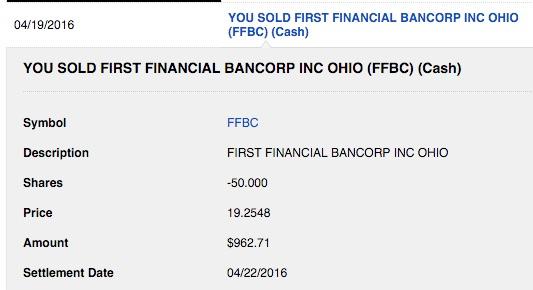
Profit: +$52.76
![]()
Trading Profits To Date: $272.81
I got confused about how many FFBC shares that I owned, having forgotten about a 50 share lot bought in my IB account last January at $15.75:

In prior tables since that date, I was showing 180 FFBC shares when I actually owned 230 exclusive of a few shares bought with reinvested dividends.
Upon realizing that I owned more than I wanted to own, I sold the highest cost 50 share lot bought last December in my Fidelity account: Scroll to 2. Added 50 FFBC at $18.04: Update For Regional Bank Basket Strategy As Of 12/28/15 - South Gent | Seeking Alpha
By selling that lot, I reduced my average cost per share in the Fidelity account to $15.08 per share:

The yellow highlighting originates from Fidelity and signals that a transaction has occurred in that stock.
I am now back to 180 shares consisting of the aforementioned 50 share bought in my IB account and 130 open market purchases in the Fidelity account. Those lots were purchased as follows:
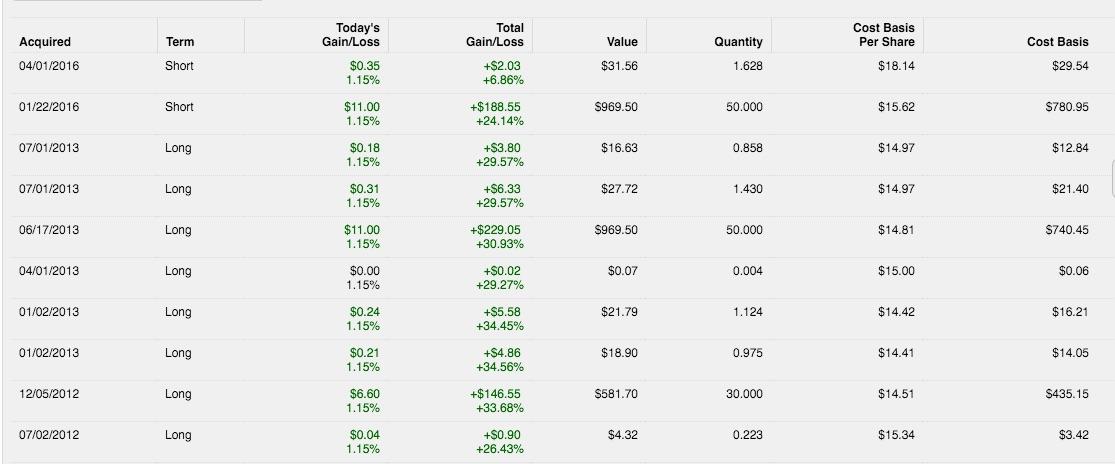
Item # 3. Averaged Down: Bought 50 FFBC at $15.46: Update For Regional Bank Basket Strategy As Of 1/28/16 - South Gent | Seeking Alpha; Item # 2 Added 30 FFBC at $14.24 (December 2012 Post); Item # 2 Added 50 FFBC at $14.65 (June 2013 Post)
I have only periodically reinvested the dividend.
With FFBC, I have been content to harvest dividends, to lower my average cost per share through trading, and to harvest profits in the highest cost lots.
As previously noted, this bank paid out of its net income per share starting in August 2011 through May 2013. Each quarterly payment during that period consisted of a $.12 per share regular dividend and a special dividend equal to the difference between that amount and the net income per share.
When the bank ceased paying the special dividend, it raised its quarterly rate from $.12 to $.15. There was no dividend cut when the bank reverted back to paying only a regular quarterly dividend.
I owned shares throughout that special dividend period and have sold them. {e.g.: Item # 4 Sold 57 FFBC at $17.03-Highest Cost Shares (12/23/13 Post)(profit snapshot +$37.68); Item # 3 Pared Highest Cost Shares by Selling 55 FFBC at $17.31 (11/1/14 Post)(profit snapshot +$110.59)}
I also had also a 50 share lot held for about one month in 2015 that generated at $53.08 profit. That lot disappeared quickly as I significantly pared my regional bank basket.
![]()
I also had one 50 lot flip in 2010.
Last Earnings Report: First Financial Bancorp Reports First Quarter 2016 Financial Results
"For the three months ended March 31, 2016, the Company reported net income of $19.8 million, or $0.32 per diluted common share, compared to net income of $19.8 million, or $0.32 per diluted common share, in the fourth quarter of 2015 and $17.6 million, or $0.29 per diluted common share, in the first quarter of 2015."
NIM: 3.68%
NPL Ratio: .95%
NPA Ratio: 1.16%
Coverage Ratio: 103.07%
Charge Off Ratio: .1%
Total Capital Ratio: 12.84%
Tangible Book Value Per Share: $9.94
Average Tangible Shareholder's Equity to Tangible Assets: 7.71%
The current consensus E.P.S. estimates are $1.39 this year and $1.48 in 2017. FFBC Analyst Estimates
Closing Price Today: FFBC: $19.07 -0.12 (-0.63%)
4. Sold Highest Cost LBAI Lot at $11.41:
Trade Snapshot ($1 Commission)

Profit Snapshot: +$40.99
![]()
Scroll to 2. Bought Back LBAI at $10.55: Update For Regional Bank Basket Strategy As Of 1/28/16 - South Gent | Seeking Alpha
I still own a 50 share lot purchased at $9.98: Item # 4. Added 50 LBAI at $9.98: Update For Regional Bank Basket Strategy As Of 3/17/16 - South Gent | Seeking Alpha
Prior Round-Trip: Item # 3 Sold 100 LBAI at $11.04 (8/9/13 Post)(profit snapshot=$142.09)-Item # 1 Bought 100 LBAI at $9.46 (April 2013); Item # 1 Bought 100 LBAI at $10.91 (3/13/15 Post
Trading Profits to Date: $213.08
Company Description: Lakeland Bancorp (NASDAQ:LBAI) is the holding company for Lakeland Bank which has 53 branches located in 8 northern New Jersey counties. The bank is headquartered in Oak Ridge, N.J. ): Corporate Profile | Lakeland Bank
Map of Branches
I looked at the HQ at Google Maps.
Deposit Marketshare | Lakeland Bank (#1 Sussex County; #10 in Morris; #16 in New Jersey)
LBAI completed its acquisition of Pascack Bancorp on 1/7/2016. I announced last February an agreement to acquire Harmony Bank in an all stock transaction then valued at $32M. "The transaction is expected to be approximately 1% accretive to Lakeland Bancorp's Earnings Per Share in 2017 and approximately 0.5% dilutive to Tangible Book Value with an estimated earn back in approximately 3.5 years." Harmony is headquartered in Jackson, New Jersey and has branches in Lakewood and Toms New Jersey.
Recent Earnings Report: I decided to jettison my highest cost lot after reading the last earnings report.
Lakeland Bancorp Reports First Quarter 2016 Earnings and Increases Cash Dividend
There were several positive features in that report.
The Board did increase the quarterly dividend by 12%. The new penny rate is $.095 per share. The stock went ex dividend on 5/4.
E.P.S. was flat at $.22 Y-O-Y after excluding "the pre-tax impact of $1.7 million in merger related expenses pertaining to the Company's acquisition of Pascack Bancorp, Inc. ("Pascack"), which closed on January 7, 2016". The share count went up to 41.240+M from $37.906+M due to that acquisition. Lakeland Bancorp to Acquire Pascack Bancorp
I do not yet see any E.P.S. benefit from that acquisition. Sure, net income increased in the first quarter Y-O-Y, but so did the share count.
Several operating metrics were impacted by the merger expenses.
"For the first quarter of 2016, annualized return on average assets was 0.77%, annualized return on average common equity was 7.40%, and annualized return on average tangible common equity was 10.40%. Excluding merger related expenses, these ratios were 0.88%, 8.45% and 11.88%, respectively." Both the ROA and ROE are below levels that I view as acceptable which are 1+% and 10+% respectively.
The NPL, NPA and charge-off ratios remain range bound at acceptable levels.
Quarterly: Far left Q/E 3/31/16 to Far Right Q/E 3/31/15
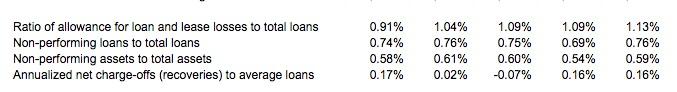
My impression of this bank is that loan losses and non-performing loans are not likely to get any better.
E.P.S. growth would consequently depend on NIM expansion, increases in fee businesses, and loan growth.
The company is experiencing organic loan and deposit growth:
"Excluding loans obtained through the acquisition of Pascack, commercial loans increased by $92.7 million, or 4%. Excluding Pascack, deposits increased $162.6 million, or 5%, since December 31, 2015."
Miscellaneous:
1. BB&T announces 3.7-percent increase in common dividend
BB&T reports net income available of $527 million, up 8%; Record net interest income exceeding $1.5
2.
Arrow (AROW) Reports 11.9% Net Income Increase, Continued Strong Loan Growth (Arrow Financial beats by $0.06)3. The First Bancorp (FNLC)Reports Record Quarterly Results | Seeking Alpha ("Net income was $4.5 million, up $328,000 or 7.9% from the first quarter of 2015 and earnings per common share on a fully diluted basis of $0.42 were up $0.03 or 7.7% from the same period in 2015.')
4.
New York Community Bancorp, Inc. (NYCB) Reports 1Q 2016 Diluted GAAP Earnings Per Share of $0.27 | Business Wire5.
Huntington Bancshares Incorporated (HBAN) Reports 2016 First Quarter Earnings Including 7% Year-Over-Year Revenue Growth and 5% Year-Over-Year EPS Growth6.
Bar Harbor Bankshares (BHB) Increases Quarterly Cash Dividend (Based on my constant total cost per share of $21.74, this raise increases my dividend yield to 4.97%.)7.
Washington Trust (WASH) Reports First Quarter 2016 Earnings ("net income of $10.9 million, or $0.64 per diluted share, for the first quarter of 2016, up from net income of $10.7 million, or $0.62 per diluted share, reported for the fourth quarter of 2015.)Washington Trust Bancorp, Inc. Increases Quarterly Dividend (This latest raise brings my dividend yield up to 9.34% based on my $15.34 total constant cost per share)
8.
Valley National Bancorp (VLY) Reports A 19 Percent Increase In First Quarter Net Income, Full Integration (E.P.S. .14 vs. .13-one cent below consensus forecast)9.
MainSource Financial Group (MSFG) Announces First Quarter 2016 Financial Results10.
Univest Corporation of Pennsylvania (UVSP) Reports First Quarter Earnings (UVSP is in the process of acquiring FXCB which reported earnings on the same day: Fox Chase Bancorp, Inc. Reports Earnings for the Three Months Ended March 31, 2016)11.
Bridge Bancorp, Inc. (BDGE) Reports First Quarter 2016 Results ("Net income for the quarter was $8.6 million or $.49 per share, compared to $4.8 million or $.41 per share for the first quarter of 2015. Core net income for the first quarter was $8.5 million or $.49 per share, compared to $4.9 million or $.42 per share, for the same period in 2015. Core net income reflects the quarterly results adjusted for certain costs, net of tax, related to the completed CNB ("Community National Bank") acquisition. In addition, 2016 earnings per share reflect the impact of the 5.6 million shares issued on June 19, 2015 in connection with the CNB acquisition.")12.
Landmark Bancorp (LARK) First Quarter Earnings Release13.
West Bancorporation, Inc. (WTBA) Announces Record First Quarter, Net Income up 11.6 Percent; Increases Quarterly Dividend Nasdaq {The quarterly dividend increase was 1 cent per share or +6.25%. The new penny rate is 17 cents per share. Based on my total cost per share of $11.75, that increases my yield to 5.79%: Bought 100 WTBA at $11.67)}14.
Southern National Bancorp of Virginia Inc. (SONA) reports earnings for the first quarter of 2016 of $2.6 million, up 28% from the first quarter the prior year, and declares a dividend of $.08 ("net income for the quarter ended March 31, 2016 was $2.6 million compared to $2.0 million during the quarter ended March 31, 2015.")15. Merchants Bancshares, Inc. Announces Dividend and First Quarter 2016 Results
16. Bar Harbor Bankshares Reports First Quarter Earnings ("record net income of $4.4 million for the first quarter of 2016, representing an increase of $525 thousand, or 13.5%, compared with the first quarter of 2015. The Company also reported record diluted earnings per share of $0.72 for the quarter, representing an increase of $0.08, or 12.5% compared with the first quarter of 2015. The Company's annualized return on average shareholders' equity amounted to 11.18% for the quarter, up from 10.57% in the first quarter of 2015. The Company's first quarter return on average assets amounted to 1.10%, up from 1.06% in the first quarter of 2015.")
17.
Old National's (ONB) 1st quarter Net Income increases 29% compared to 1st quarter 2015; Moody's confirms Old National (Senior Unsecured A3) following acquisition of Anchor Bancorp;Comparative Data:
Comparative Data From the St. Louis Federal Reserve:
Net Interest Margin for all U.S. Banks (abbreviated to "NIM")
Net Interest Margin for U.S. Banks with average assets under $1B
Net Interest Margin for U.S. Banks with average assets between $1B and $15B
Return on Average Equity for all U.S. Banks (abbreviated to "ROE")
Return on Average Assets for all U.S. Banks (abbreviated to "ROA")
Nonperforming Loans (past due 90+ days plus nonaccrual) to Total Loans for all U.S. Banks (abbreviated to "NPL Ratio")
Charge-Off Rate On All Loans, All Commercial Banks
Net Percentage of Domestic Banks Tightening Standards on Consumer Loans, Credit Cards-St. Louis Fed (trending toward zero)
Net Percentage of Domestic Banks Tightening Standards for Commercial and Industrial Loans to Large and Middle-Market Firms-St. Louis Fed (recently increased over zero)
Net Percentage of Domestic Banks Tightening Standards for Commercial and Industrial Loans to Small Firms-St. Louis Fed (recently increased over zero)
Disclaimer: I am not a financial advisor but simply an individual investor who has been managing my own money since I was a teenager. In this post, I am acting solely as a financial journalist focusing on my own investments. The information contained in this post is not intended to be a complete description or summary of all available data relevant to making an investment decision. Instead, I am merely expressing some of the reasons underlying the purchase or sell of securities. Nothing in this post is intended to constitute investment or legal advice or a recommendation to buy or to sell. All investors need to perform their own due diligence before making any financial decision which requires at a minimum reading original source material available at the SEC and elsewhere. A failure to perform due diligence only increases what I call "error creep". Stocks, Bonds & Politics: ERROR CREEP and the INVESTING PROCESS. Each investor needs to assess a potential investment taking into account their personal risk tolerances, goals and situational risks. I can only make that kind of assessment for myself and family members.